
- Bitcoin price started a fresh decline after it failed to surpass $35,000 against the US Dollar.
- The price is now trading well below the $34,250 zone and the 55 simple moving average (4-hours).
- There is a major declining channel forming with resistance near $34,000 on the 4-hours chart of the BTC/USD pair (data feed from Coinbase).
- The pair is likely to continue lower towards the $30,000 support zone in the near term.
Bitcoin price is slowly moving lower below $33,000 against the US Dollar. BTC must stay above the $30,000 zone to avoid a larger decline in the near term.
Bitcoin Price Analysis
Bitcoin price failed to clear the $35,000 resistance and it started a fresh decline. BTC broke the $34,200 and $33,500 support levels to move back into a bearish zone.
The pair broke the 50% Fib retracement level of the upward move from the $32,140 swing low to $34,704 high. It is now trading well below the $34,250 zone and the 55 simple moving average (4-hours). The price even broke the $33,000 support zone.
It is now consolidating below the 76.4% Fib retracement level of the upward move from the $32,140 swing low to $34,704 high. An immediate support on the downside is near the $32,200 zone.
If there is a downside break below the $32,200 zone, the pair could decline steadily towards the $31,200 level. The next major support for the bulls is near the $30,000 zone. An immediate resistance is near the $33,000 level.
The next major resistance is forming near the $33,500 zone and the 55 SMA. There is also a major declining channel forming with resistance near $34,000 on the 4-hours chart of the BTC/USD pair. A clear break above the channel resistance could set the pace for a larger increase above $34,000. The next major resistance on the upside could be $35,000.
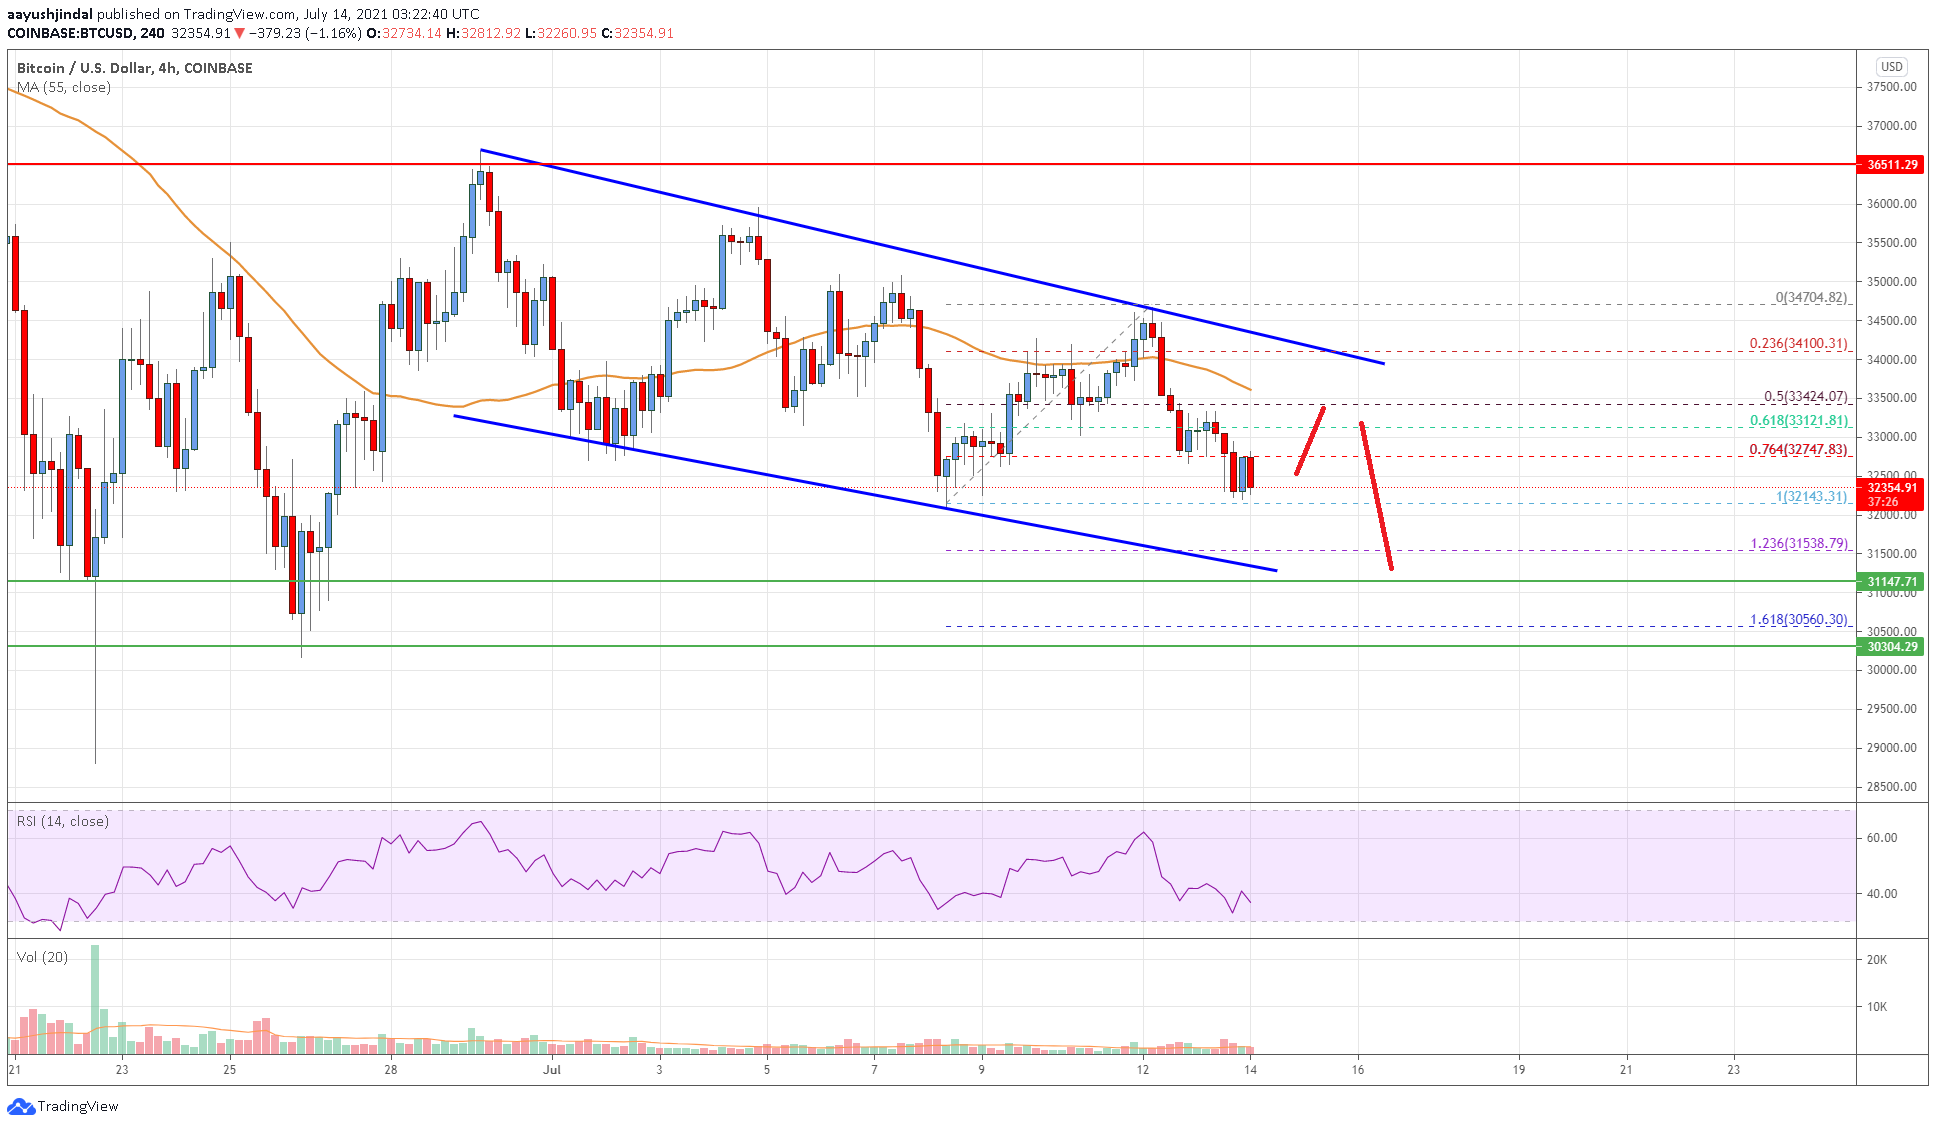
Looking at the chart, bitcoin price is clearly trading well below $34,000 and the 55 simple moving average (4-hours). Overall, the price is likely to continue lower towards the $30,000 support zone in the near term.
Technical indicators
4 hours MACD – The MACD is slowly gaining momentum in the bearish zone.
4 hours RSI (Relative Strength Index) – The RSI is now well below the 50 level.
Key Support Levels – $32,200 and $30,000.
Key Resistance Levels – $33,500, $34,000 and $35,000.


Leave a Reply
You must be logged in to post a comment.