
- Bitcoin price started a strong increase above the $11,830 and $12,000 resistance levels against the US Dollar.
- The price is now trading well above the $12,000 support and the 55 SMA (H4).
- There was a break above a crucial contracting triangle with resistance near $11,520 on the 4-hours chart of the BTC/USD pair (data feed from Coinbase).
- The pair is likely to rally further if it clears the $12,300 and $12,500 resistance levels.
Bitcoin price is gaining pace above the $12,000 resistance zone against the US Dollar. BTC is showing positive signs and it could even surpass the $12,500 level.
Bitcoin Price Analysis
In the past few days, bitcoin price consolidating above the $11,260 support level against the US Dollar. Finally, BTC was able to gain bullish momentum above the $11,400 and $11,560 resistance levels.
To start the recent increase, there was a break above a crucial contracting triangle with resistance near $11,520 on the 4-hours chart of the BTC/USD pair. The pair surged and cleared the $11,830 and $12,000 resistance levels.
It is now trading well above the $12,000 support and the 55 simple moving average (4-hours). A high is formed near the $12,310 level and the price is currently showing a lot of positive signs. An initial support on the downside is near the $12,150 level.
The 23.6% Fib retracement level of the recent increase from the $11,661 swing low to $12,310 high is also near $12,150. The first major support is seen near the $12,000 level (the recent breakout zone).
The 50% Fib retracement level of the recent increase from the $11,661 swing low to $12,310 high is also close to the $12,000 support level. Any further losses might call for a test of the $11,500 support or the 55 SMA (H4).
Conversely, bitcoin price might continue to rise above the $12,300 and $12,400 levels. The next major resistance is near the $12,500 level, above which the bulls are likely to aim a test of the $12,800 level or even $13,000.
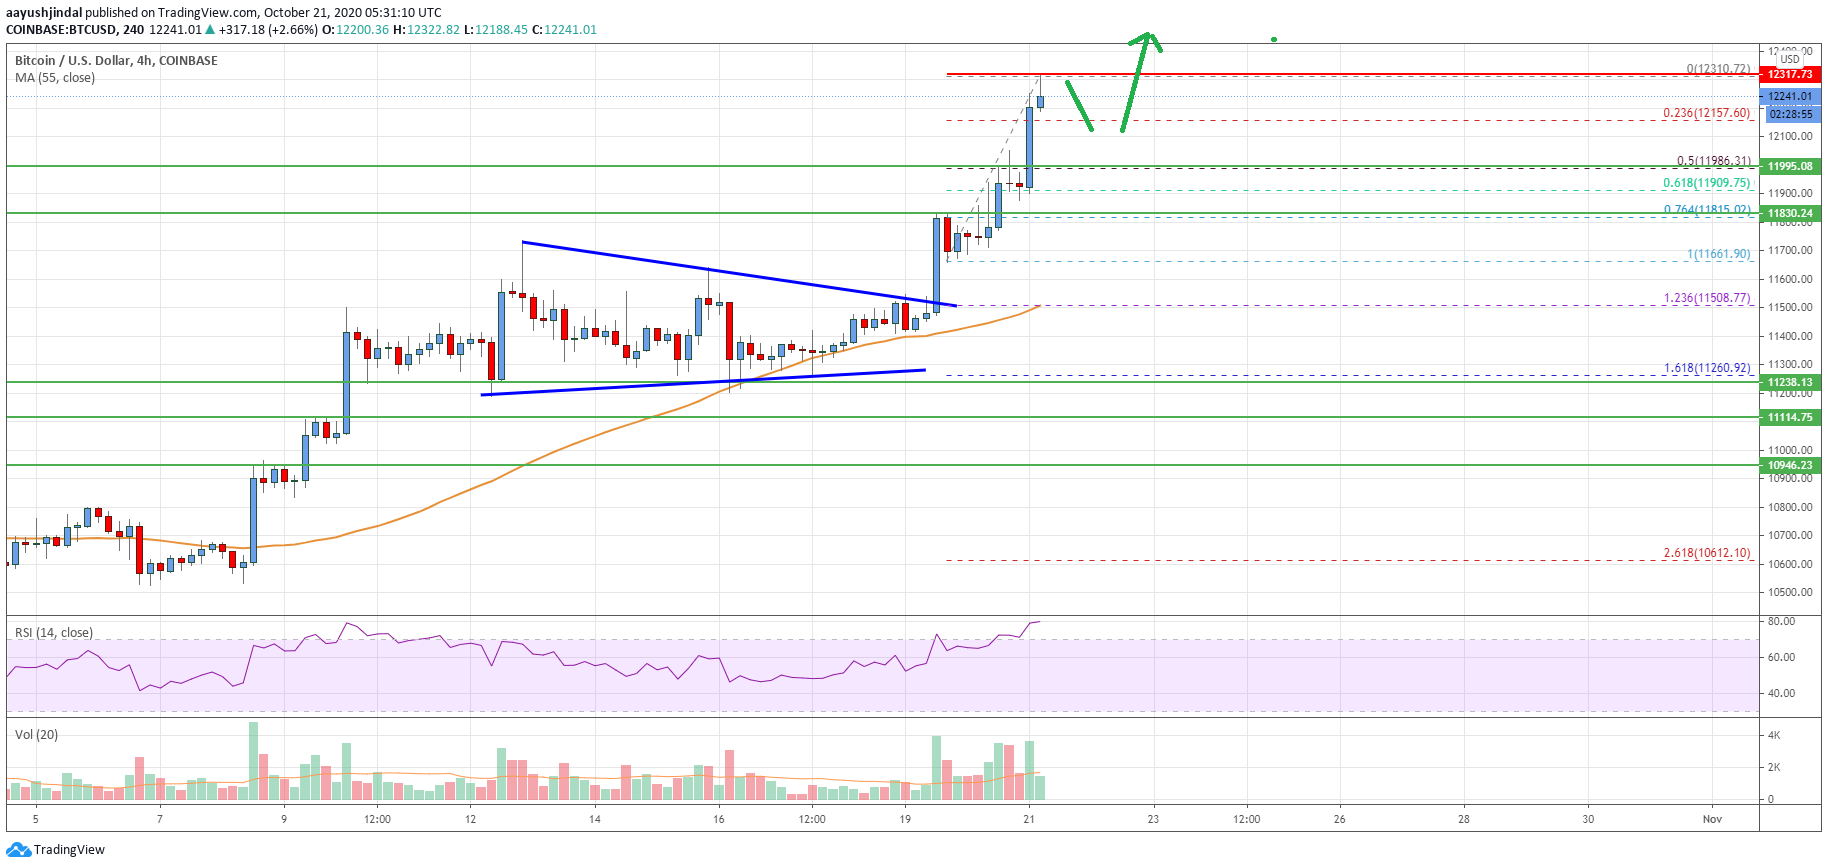
Looking at the chart, bitcoin price is clearly trading in a bullish zone above the $12,000 support and the 55 SMA (H4). Therefore, the price is likely to rally further if it clears the $12,300 and $12,500 resistance levels in the near term.
Technical indicators
4 hours MACD – The MACD is showing positive signs in the bullish zone.
4 hours RSI (Relative Strength Index) – The RSI is now well above the 60 level.
Key Support Levels – $12,150 and $12,000.
Key Resistance Levels – $12,300, $12,400 and $12,500.


Leave a Reply
You must be logged in to post a comment.