- Bitcoin price is struggling to clear the $37,800 and $38,000 resistance levels against the US Dollar.
- The price is now trading well below $36,000 and the 55 simple moving average (4-hours).
- There is a major contracting triangle forming with support near $35,200 on the 4-hours chart of the BTC/USD pair (data feed from Coinbase).
- The pair could decline sharply if it clears the $35,200 and $35,000 support levels.
Bitcoin price is slowly moving lower below $36,000 against the US Dollar. BTC could decline heavily if it settles below $35,000 and $34,500 in the near term.
Bitcoin Price Analysis
In the past few days, there was a bearish reaction in bitcoin price below $39,200 against the US Dollar. BTC started a fresh decline and it traded below the $38,000 and $37,500 support levels.
The last swing high is near $37,900 and it is now trading below the $38,000 level. There was a break below the $36,500 support level and the 55 simple moving average (4-hours). There was a break below the 50% Fib retracement level of the upward move from the $33,911 swing low to $37,900 high.
It seems like there is a major contracting triangle forming with support near $35,200 on the 4-hours chart of the BTC/USD pair. The triangle support is close to the 61.8% Fib retracement level of the upward move from the $33,911 swing low to $37,900 high.
If there is a downside break below the triangle support and $35,000, bitcoin price might accelerate lower. In the stated case, the bears are likely to aim a test of $34,000.
Any more losses could open the doors for a push towards the $32,000 support zone. On the upside, there is a key hurdle forming near $36,000 and the 55 simple moving average (4-hours). The main resistance is forming near the $38,500 level.
A clear break above the $38,000 and $38,500 resistance levels could open the doors for a push towards the $40,000 level in the coming sessions.
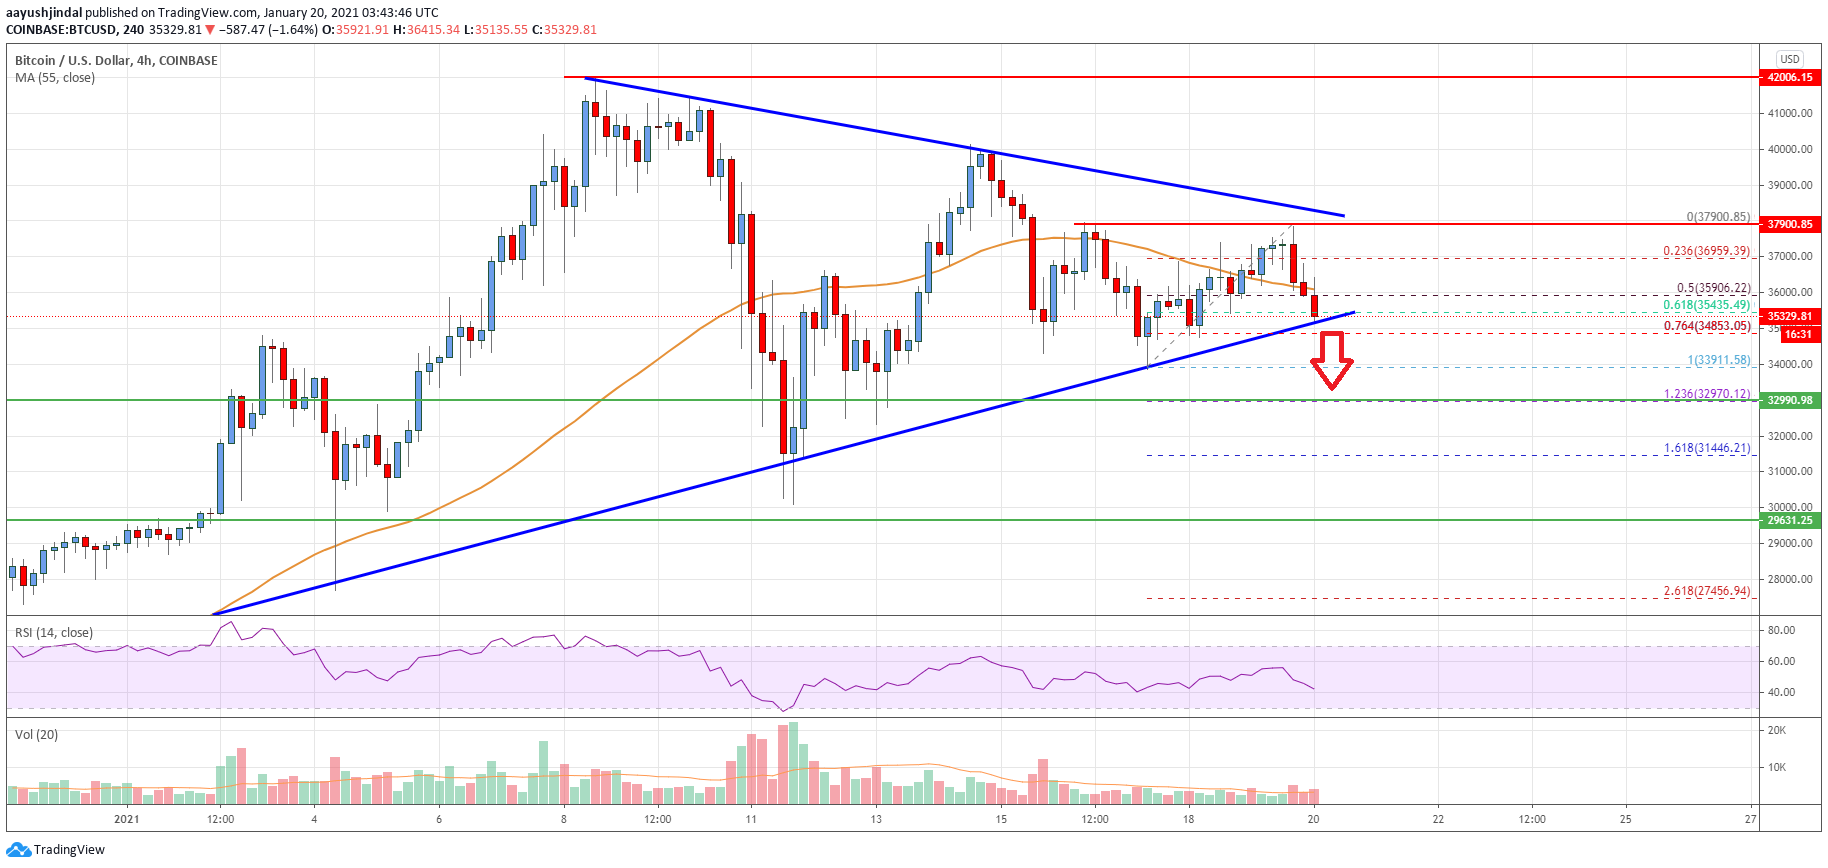
Looking at the chart, bitcoin price is clearly trading well below $37,000 and the 55 simple moving average (4-hours). Overall, the price could decline sharply if it clears the $35,200 and $35,000 support levels.
Technical indicators
4 hours MACD – The MACD is now gaining momentum in the bearish zone.
4 hours RSI (Relative Strength Index) – The RSI is now declining below the 50 level.
Key Support Levels – $35,000 and $32,000.
Key Resistance Levels – $36,500, $37,500 and $38,000.
