Key Points
- Bitcoin price struggled to hold gains Intraday, and as a result, there was a crucial break noted.
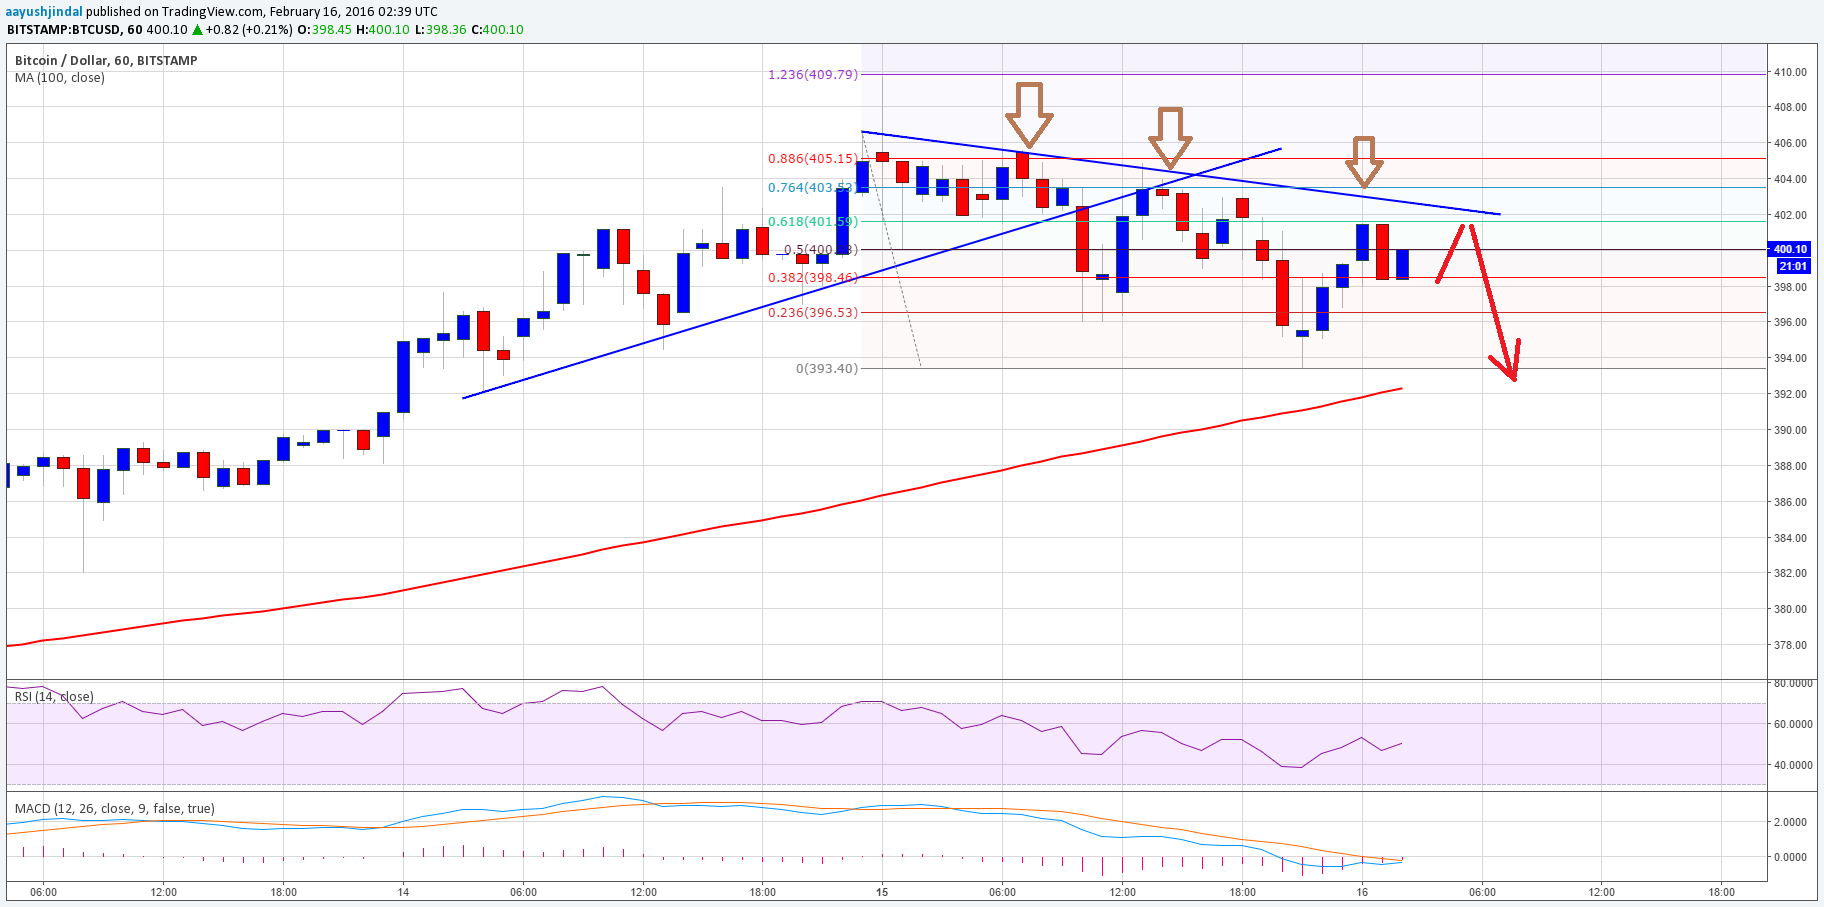
- Sellers managed to break a support trend line on the hourly chart (data feed from Bitstamp), which may take the price further down.
- The price is now struggling to settle above the $400 level, and there is a resistance trend line formed as well to act as a barrier for buyers.
Bitcoin price looks like struggling to sustain the bullish momentum, and if sellers gain traction a move towards $380 is possible.
Bitcoin Price- Sell Near Trend Line Resistance?
Bitcoin price was showing positive signs during the start of the trading week. However, there was a little selling pressure noted Intraday. As a result, there was a downside move, and the price cleared the channel support trend line, as highlighted yesterday on the hourly chart (data feed from Bitstamp). The price even breached the $400 support area and currently making an attempt to close back above it.
There are a few bearish signs emerging on the same chart, a resistance trend line is forming that could act as a barrier for the bulls if they try to take the price higher. As long as the price is below the highlighted trend line and resistance area, there is a chance of it moving down.
Moreover, the 61.8% Fib retracement level of the last drop from the $406 high to $393 low is also around the trend line resistance area. So, it can be seen as a sell zone moving ahead. On the positive side, the price is still above the 100 hourly simple moving average, which may give a reason for the bulls to take Bitcoin price higher.
Looking at the technical indicators:
Hourly MACD – The hourly MACD is about to change the slope to bullish, which may encourage bulls.
RSI (Relative Strength Index) – The hourly RSI is just around the 50 level, calling for a break.
Intraday Support Level – $395
Intraday Resistance Level – $400-05
Charts from Bitstamp; hosted by Trading View


