
- ADA price is currently consolidating in a tight range below the $0.0320 resistance against the US Dollar.
- The price is holding the key $0.0280 support level and the 55 simple moving average (4-hours).
- There is a key bullish trend line forming with support near $0.0284 on the 4-hours chart (data feed via Kraken).
- The price could start a strong rise above the $0.0320 and $0.0340 resistance levels in the near term.
Cardano price is making an attempt to rise above key hurdles against the US Dollar and bitcoin. However, ADA price must climb above $0.0320 to continue higher.
Cardano Price Analysis
In the past few days, cardano price started a decent recovery above the $0.0250 resistance against the US Dollar. The ADA/USD pair even broke the $0.0300 resistance level and the 55 simple moving average (4-hours).
Finally, there was a spike above the $0.0320 level, but it failed to continue higher. A swing high is formed near $0.0341 and the price is currently correcting lower. It declined towards the $0.0250 support and traded as low as $0.0266.
At the outset, the price is consolidating in a tight range and trading near the $0.0300 resistance. It is testing the 50% Fibonacci retracement level of the recent decline from the $0.0341 high to $0.0266 low.
On the upside, there is a major hurdle forming near the $0.0320 level. It coincides with the 76.4% Fibonacci retracement level of the recent decline from the $0.0341 high to $0.0266 low.
An immediate resistance is near the $0.0305 level. If the price climbs above the $0.0305 and $0.0320 resistance levels, it could start a strong rise in the near term. The next major hurdle is near the $0.0350 level, above which the price is likely to continue higher towards $0.0400.
Conversely, the price could fail to continue above the $0.0320 resistance area. On the downside, an initial support is near the $0.0284 level and the 55 simple moving average (4-hours).
There is also a key bullish trend line forming with support near $0.0284 on the 4-hours chart. If there is a downside break below the $0.0284 and $0.0280 support levels, it could dive towards $0.0250 or $0.0220.
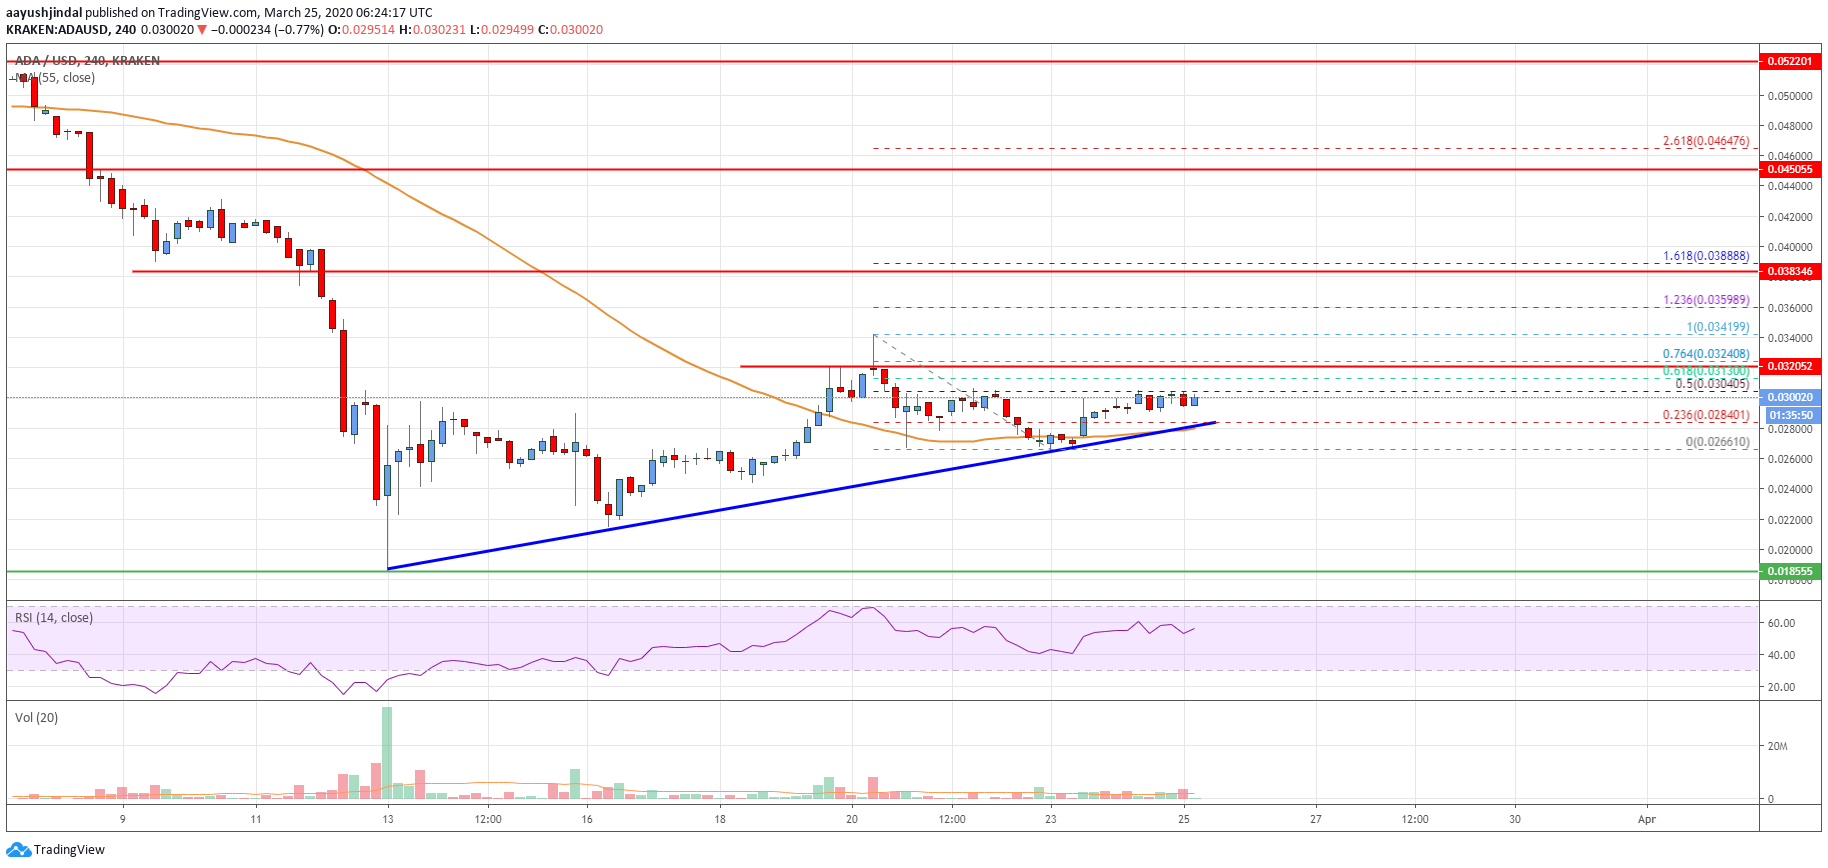
The chart indicates that ADA price is consolidating in a tight range below the $0.0320 resistance. If there is a clear break above $0.0320, the price is likely to rise steadily. If not, there is a risk of a sharp decline below $0.0280.
Technical Indicators
4 hours MACD – The MACD for ADA/USD is currently losing momentum in the bullish zone.
4 hours RSI – The RSI for ADA/USD is currently above the 50 level.
Key Support Levels – $0.0280 and $0.0250.
Key Resistance Levels – $0.0305 and $0.0320.


Leave a Reply
You must be logged in to post a comment.