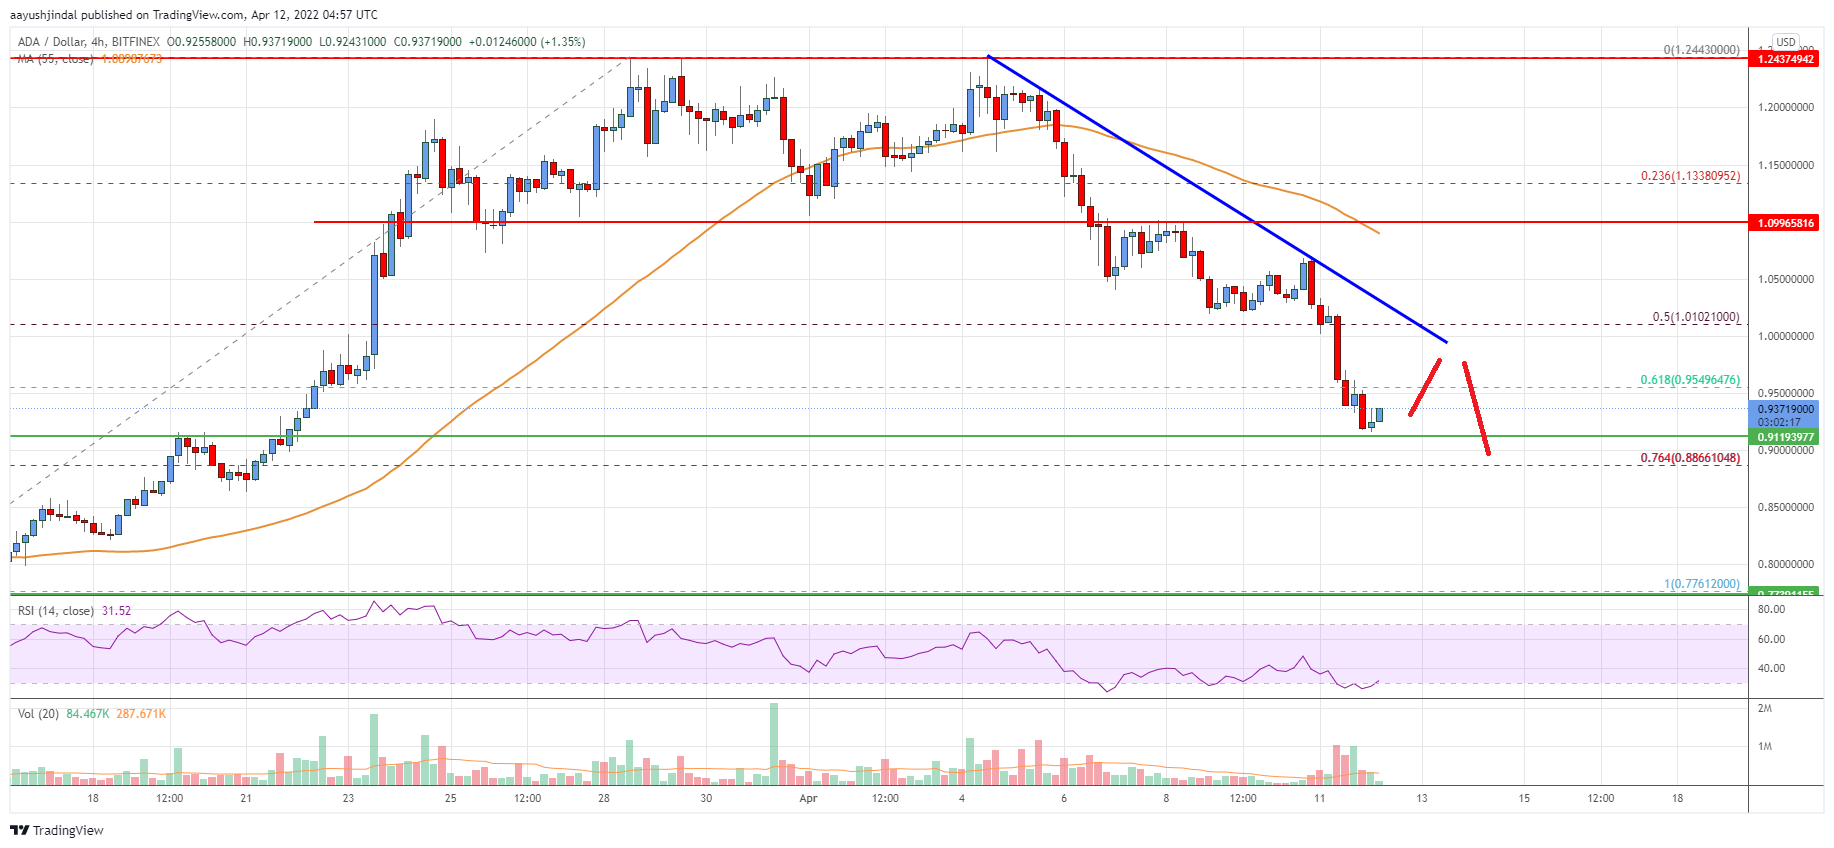
- ADA price started a strong decline from the $1.24 resistance against the US Dollar.
- The price is now trading below $1.10 and the 55 simple moving average (4-hours).
- There is a key bearish trend line forming with resistance near $1.00 on the 4-hours chart (data feed via Bitfinex).
- The price could continue to move down if there is a break below the $0.920 support.
Cardano price is declining below $1.00 against the US Dollar, similar to bitcoin. ADA price could accelerate further lower if it stays below $1.00.
Cardano Price Analysis
This week, cardano price saw a fresh decline from the $1.25 resistance zone against the US Dollar. The ADA/USD pair traded below the $1.12 and $1.10 support levels to move into a bearish zone.
The price declined below the 50% Fib retracement level of the upward move from the $0.761 swing low to $1.245 high. It is now trading below $1.10 and the 55 simple moving average (4-hours). On the downside, an immediate support is near the $0.920 level.
The next major support is near the $0.886 level. It is near the 76.4% Fib retracement level of the upward move from the $0.761 swing low to $1.245 high.
If there are additional losses, the price may perhaps decline towards the $0.780 support level. A break below $0.780 could push the price towards the $0.70 level. On the upside, an immediate resistance is near the $0.95 level.
The first key resistance might be near the $1.00 level. There is also a key bearish trend line forming with resistance near $1.00 on the 4-hours chart. A clear upside break above the $1.00 level might send the price towards the $1.05 resistance.
The next key resistance might be near the $1.05 level. Any more gains could start a steady increase towards the $1.12 level in the near term. An intermediate resistance might be near $1.10 and the 55 simple moving average (4-hours).

The chart indicates that ADA price is now trading below $1.10 and the 55 simple moving average (4-hours). Overall, the price could continue to move down if there is a break below the $0.920 support.
Technical Indicators
4 hours MACD – The MACD for ADA/USD is now gaining pace in the bearish zone.
4 hours RSI – The RSI for ADA/USD is now well below the 50 level.
Key Support Levels – $0.920 and $0.886.
Key Resistance Levels – $1.00 and $1.05.


Leave a Reply
You must be logged in to post a comment.