- ADA price is showing positive signs above the $0.450 resistance against the US Dollar.
- The price is now trading above $0.450 and the 55 simple moving average (4-hours).
- There was a break above a key bearish trend line with resistance near $0.4520 on the 4-hours chart (data feed via Bitfinex).
- The price could continue to move up if it clears the $0.500 resistance zone.
Cardano price is rising above $0.455 against the US Dollar, similar to bitcoin. ADA price could gain bullish momentum if it clears the $0.500 resistance.
Cardano Price Analysis
This past week, cardano price started an upside correction above the $0.420 level against the US Dollar. The ADA/USD pair was able to clear the $0.430 and $0.442 resistance levels.
Besides, there was a break above a key bearish trend line with resistance near $0.4520 on the 4-hours chart. The pair even climbed above the $0.488 resistance and spiked above the $0.500 level. A high is formed near $0.5018 and the price is now consolidating gains.
There was a move below the $0.490 level. The price declined below the 23.6% Fib retracement level of the upward move from the $0.4025 swing low to $0.5018 high.
On the downside, an immediate support is near the $0.470 level. The next major support is near the $0.462 level, below which the price may perhaps decline towards the $0.450 support level. It is near the 50% Fib retracement level of the upward move from the $0.4025 swing low to $0.5018 high.
Any more losses might call for a test of the $0.44 level. On the upside, an immediate resistance is near the $0.490 zone. The next major resistance is near the $0.495 level.
The main hurdle is near $0.500. A clear upside break above the $0.500 level might send the price towards the $0.535 resistance. Any more gains could start a steady increase towards the $0.588 level in the near term.
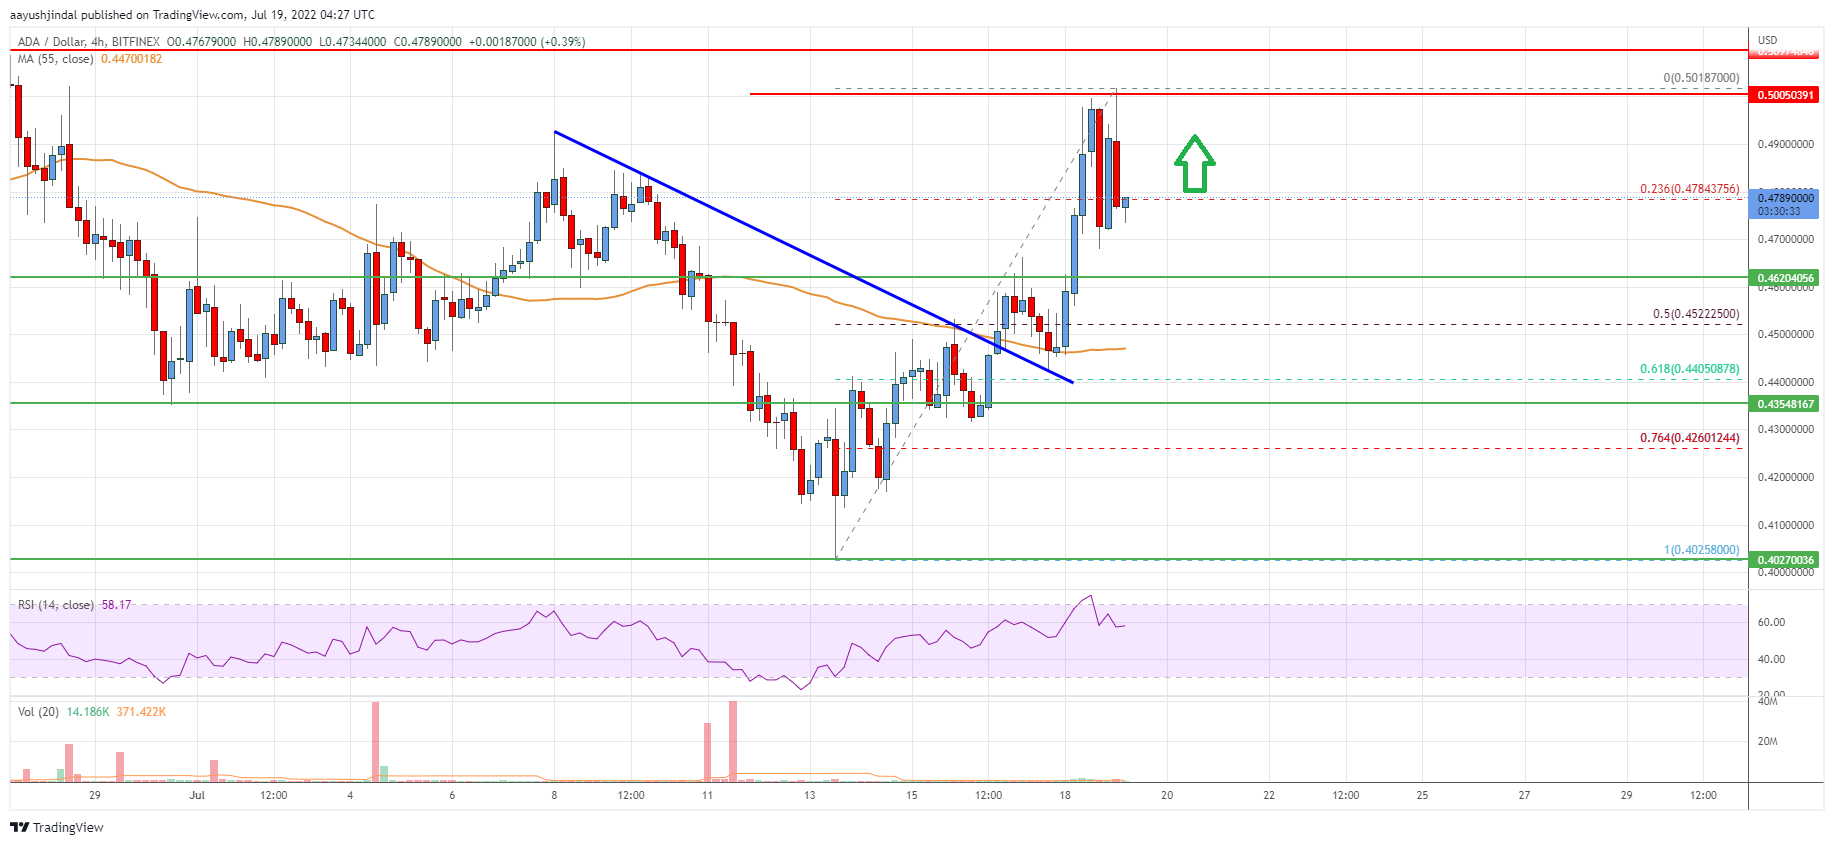
The chart indicates that ADA price is now trading above $0.450 and the 55 simple moving average (4-hours). Overall, the price could continue to move up if it clears the $0.500 resistance zone.
Technical Indicators
4 hours MACD – The MACD for ADA/USD is now gaining pace in the bullish zone.
4 hours RSI – The RSI for ADA/USD is now above the 50 level.
Key Support Levels – $0.460 and $0.450.
Key Resistance Levels – $0.495 and $0.500.
