- ADA price extended its decline below the $0.50 support zone against the US Dollar.
- The price is now trading below $0.50 and the 55 simple moving average (4-hours).
- There was a break below a major bullish trend line with support near $0.580 on the 4-hours chart (data feed via Bitfinex).
- The price could start a recovery wave if it stays above the $0.435 support zone.
Cardano price is struggling below $0.55 against the US Dollar, similar to bitcoin. ADA price could gain bullish momentum if it clears $0.50 and $0.52.
Cardano Price Analysis
This week, cardano price saw a major decline from the $0.68 resistance zone against the US Dollar. The ADA/USD pair gained pace below the $0.60 level to move into a bearish zone.
The price settled below $0.55 and the 55 simple moving average (4-hours). Besides, there was a break below a major bullish trend line with support near $0.580 on the 4-hours chart. The price even traded below the $0.500 support zone.
A low is formed near $0.437 and the price is now consolidating losses. On the upside, an immediate resistance is near the $0.50 zone. It is near the 23.6% Fib retracement level of the downward move from the $0.669 swing high to $0.437 low.
The next major resistance is near the $0.550 level. It is close to the 50% Fib retracement level of the downward move from the $0.669 swing high to $0.437 low. A clear upside break above the $0.55 level might send the price towards the $0.60 resistance.
Any more gains could start a steady increase towards the $0.70 level in the near term. On the downside, an immediate support is near the $0.450 level.
The next major support is near the $0.435 level. If there are additional losses, the price may perhaps decline towards the $0.40 support level. A break below $0.40 could push the price towards the $0.38 level.
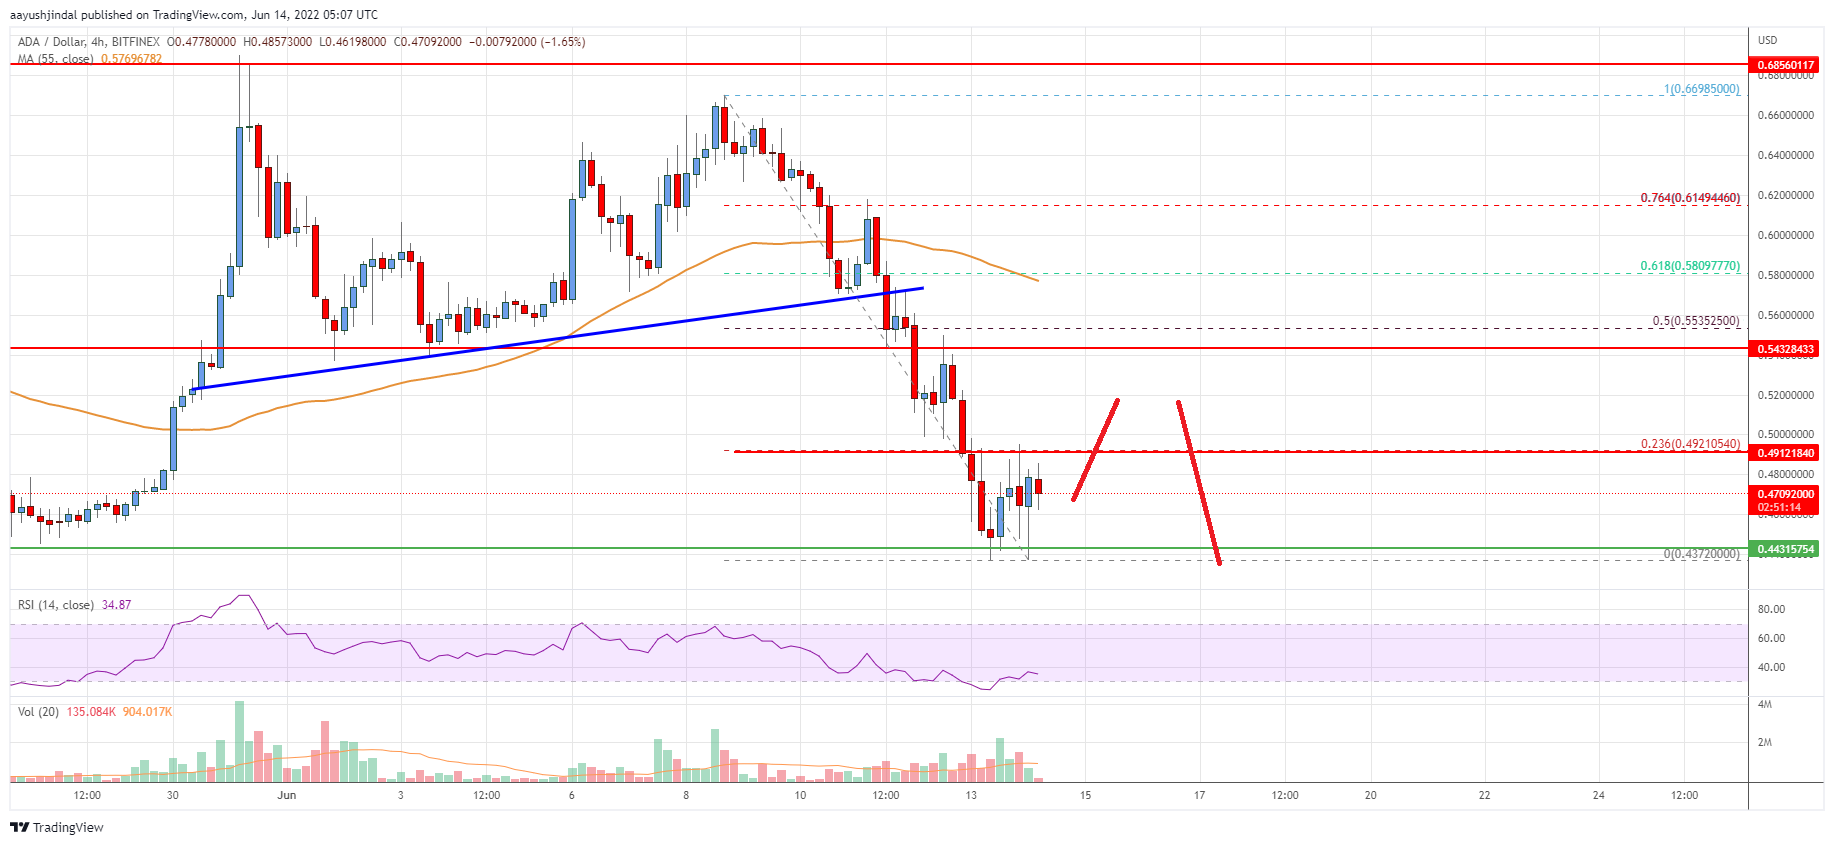
The chart indicates that ADA price is now trading below $0.50 and the 55 simple moving average (4-hours). Overall, the price could start a recovery wave if it stays above the $0.435 support zone.
Technical Indicators
4 hours MACD – The MACD for ADA/USD is now losing pace in the bearish zone.
4 hours RSI – The RSI for ADA/USD is now below the 50 level.
Key Support Levels – $0.435 and $0.400.
Key Resistance Levels – $0.500 and $0.550.
