
- ADA price declined sharply after it failed to surpass the $0.0375 resistance against the US Dollar.
- It traded as low as $0.0319 and it is currently correcting higher.
- There is a major bearish trend line with resistance near $0.0342 on the 4-hours chart (data feed via Kraken).
- The price is likely to restart its downtrend if there is no break above $0.0350.
Cardano price is showing a few recovery signs against the US Dollar, similar to bitcoin. ADA price must surpass the $0.0350 resistance to start a fresh increase in the near term.
Cardano Price Analysis
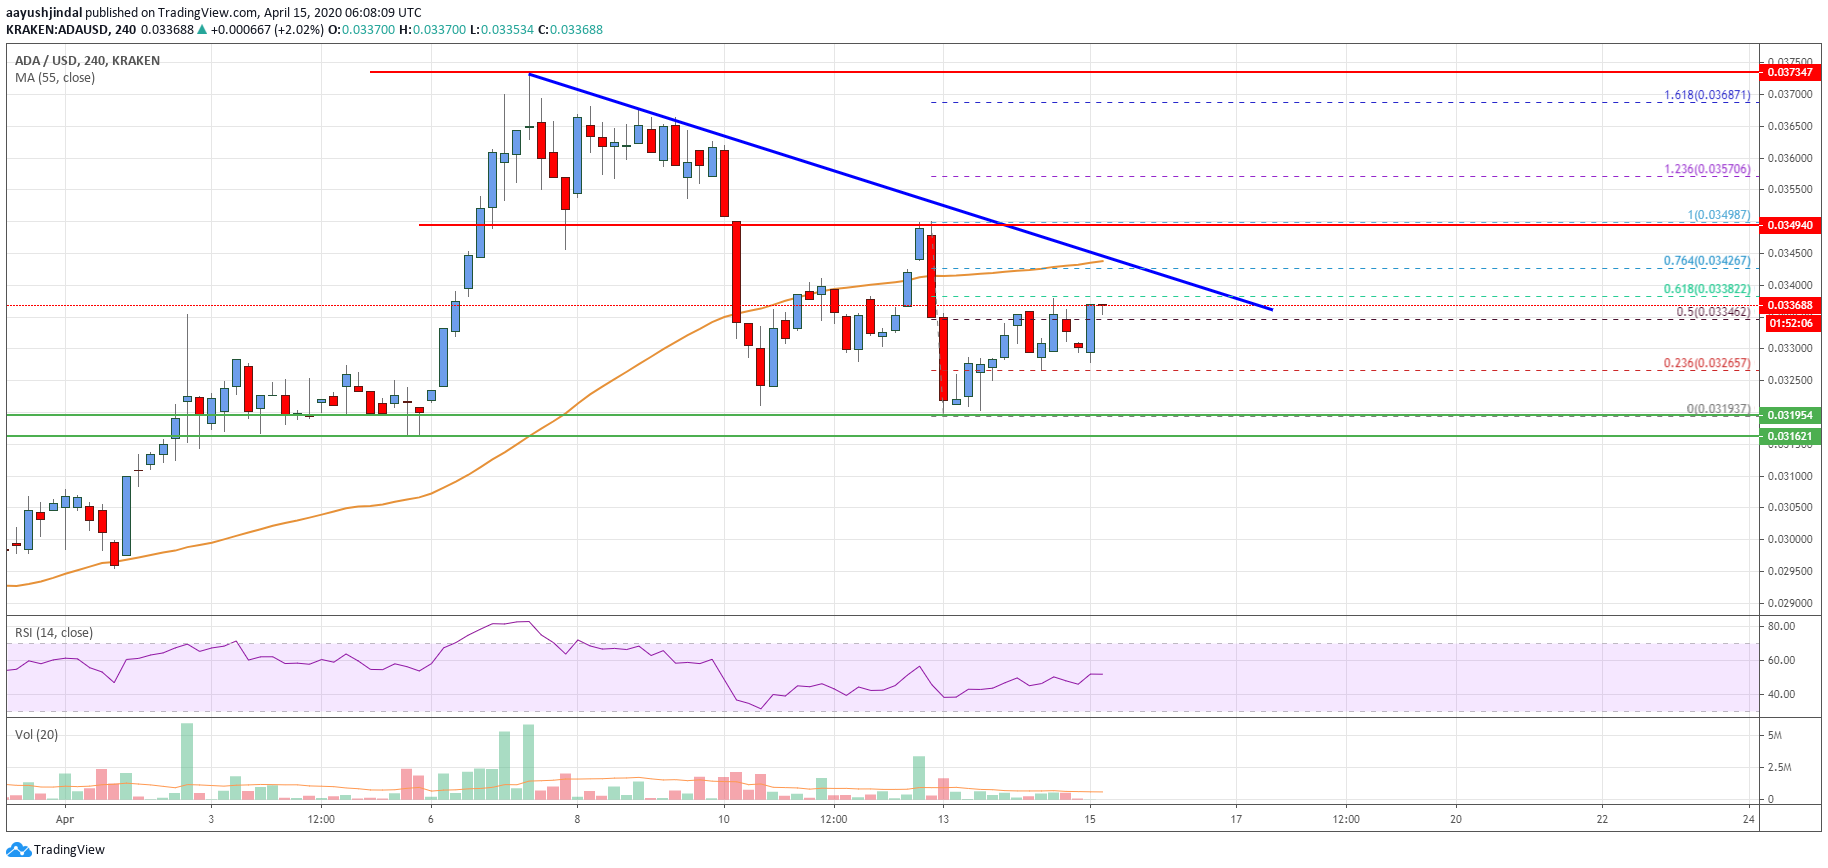
This past week, cardano price struggled to continue above the $0.0375 and $0.0400 resistance levels against the US Dollar. The ADA/USD pair formed a short term top near $0.0375 and declined sharply below the $0.0350 level.
The decline was such that the price settled below $0.0345 and the 55 simple moving average (4-hours). The price traded as low as $0.0319 and it is currently correcting higher. It recovered above the $0.0330 level.
There was a break above the 50% Fibonacci retracement level of the recent decline from the $0.0349 high to $0.0319 low. On the upside, an initial resistance is near the $0.0342 level and the 55 simple moving average (4-hours).
There is also a major bearish trend line with resistance near $0.0342 on the 4-hours chart. The trend line is close to the 76.4% Fibonacci retracement level of the recent decline from the $0.0349 high to $0.0319 low.
The main resistance is near the $0.0345 level, above which cardano price is likely to start a strong increase. The next key resistance is near the $0.0375 level. Any further gains could lead the price towards the $0.0400 barrier.
Conversely, the price is likely to struggle near the $0.0342 and $0.0345 resistance levels. In the mentioned case, the price might start another decline towards $0.0320.
If the bears clear the $0.0320 support area, the price could decline sharply towards the $0.0305 and $0.0300 support levels in the near term. Any further losses might call for a test of the $0.0285 support.
The chart indicates that ADA price is showing a few recovery signs above the $0.0320 and $0.0330 levels. Having said that, the bulls must push the price above $0.0345 to start a decent increase.
Technical Indicators
4 hours MACD – The MACD for ADA/USD is struggling to gain momentum in the bullish zone.
4 hours RSI – The RSI for ADA/USD is now just above the 55 level.
Key Support Levels – $0.0320 and $0.0305.
Key Resistance Levels – $0.0345 and $0.0375.


Leave a Reply
You must be logged in to post a comment.