- ADA price started a downside correction from the $0.556 zone against the US Dollar.
- The price is now trading below $0.52 and the 55 simple moving average (4-hours).
- There is a key bullish trend line forming with support near $0.4750 on the 4-hours chart (data feed via Bitfinex).
- The price could start a fresh increase if it stays above the $0.475 support zone.
Cardano price is correcting lower below $0.520 against the US Dollar, similar to bitcoin. ADA price must stay above the $0.475 zone to avoid more downsides.
Cardano Price Analysis
This past week, cardano price started a decent increase above the $0.500 level against the US Dollar. The ADA/USD pair was able to clear the $0.520 and $0.525 resistance levels.
The pair even climbed above the $0.540 resistance and spiked above the $0.550 level. A high is formed near $0.556 and the price is now correcting gains. There was a move below the $0.520 level. The price declined below the 50% Fib retracement level of the upward move from the $0.4511 swing low to $0.556 high.
It is now trading below $0.52 and the 55 simple moving average (4-hours). On the downside, an immediate support is near the $0.490 level. It is near the 61.8% Fib retracement level of the upward move from the $0.4511 swing low to $0.556 high.
The next major support is near the $0.475 level. Besides, there is a key bullish trend line forming with support near $0.4750 on the 4-hours chart. Any more losses might send the price towards the $0.42 support.
On the upside, an immediate resistance is near the $0.520 zone. The next major resistance is near the $0.540 level. The main hurdle is near $0.550. A clear upside break above the $0.550 level might send the price towards the $0.565 resistance. Any more gains could start a steady increase towards the $0.600 level in the near term.
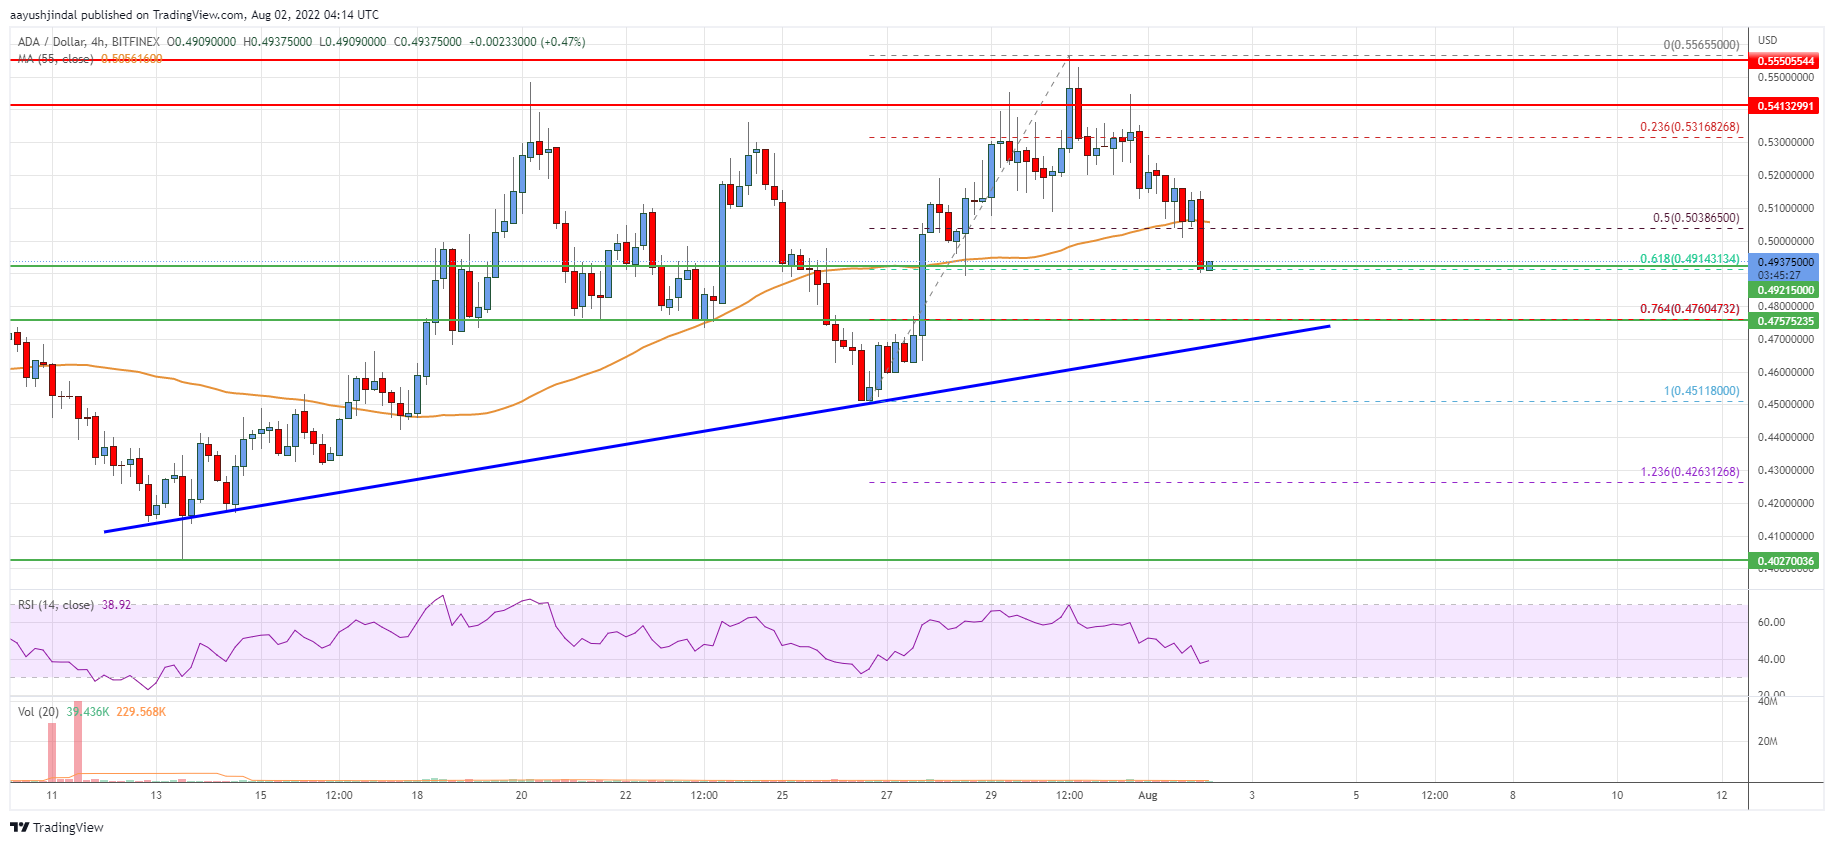
The chart indicates that ADA price is now trading below $0.52 and the 55 simple moving average (4-hours). Overall, the price could start a fresh increase if it stays above the $0.475 support zone.
Technical Indicators
4 hours MACD – The MACD for ADA/USD is now gaining pace in the bearish zone.
4 hours RSI – The RSI for ADA/USD is now below the 50 level.
Key Support Levels – $0.475 and $0.450.
Key Resistance Levels – $0.520 and $0.550.
