- ADA price started consolidating losses above the $0.0350 support area against the US Dollar.
- The price is facing a strong resistance near the $0.0400 and $0.0420 levels.
- There is a key bearish trend line forming with resistance near $0.0420 on the 4-hours chart (data feed via Kraken).
- The price could either start a decent recovery above $0.0420 or it might decline further below $0.0350.
Cardano price is struggling to recover against the US Dollar and bitcoin. ADA price could start a decent recovery if it breaks $0.0400 and $0.0420.
Cardano Price Analysis
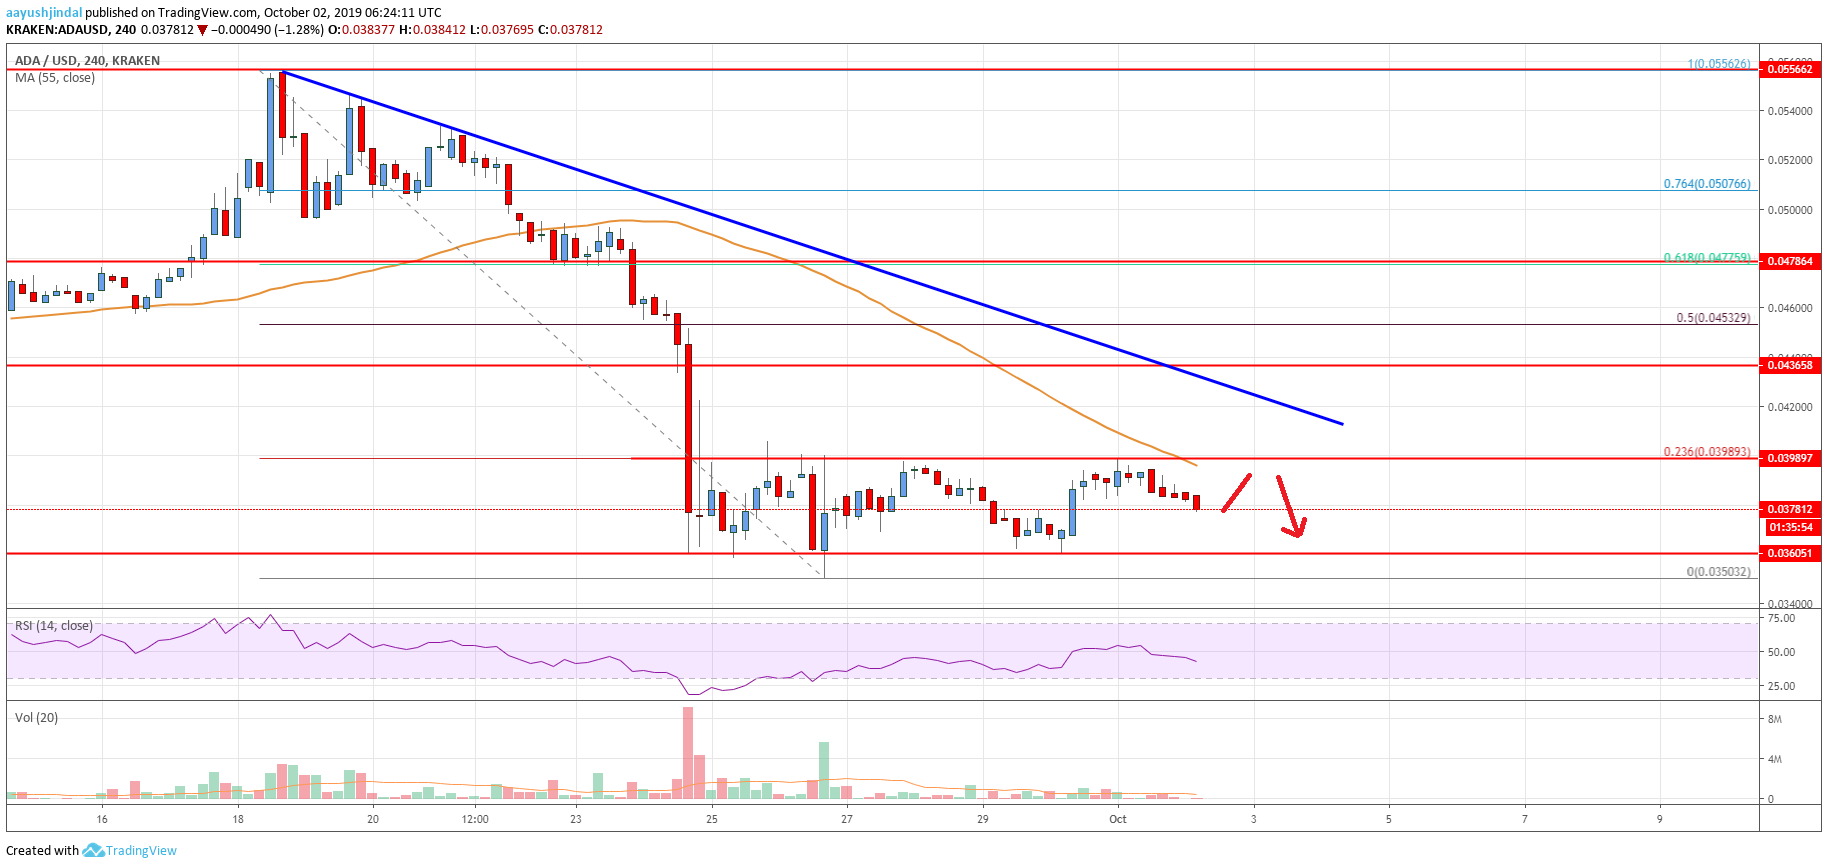
This past week, there was a downside extension below $0.0450 in cardano price against the US Dollar. The ADA/USD pair even broke the $0.0400 support and settled well below the 55 simple moving average (4-hours). Finally, the price declined below the $0.0380 level and traded to a new monthly low at $0.0350. Recently, the price started trading in a range above $0.0350 and consolidated losses.
On the upside, the price seems to be facing a strong resistance near $0.0398 and $0.0400. Furthermore, the 23.6% Fibonacci retracement level of the last key drop from the $0.0556 high to $0.0350 low is also near the $0.0398 level. Besides, the 55 simple moving average (4-hours) is now positioned near the $0.0395 level to stop the upward move.
There is also a key bearish trend line forming with resistance near $0.0420 on the 4-hours chart. Therefore, there are many hurdles forming near the $0.0400 and $0.0420 levels. A clear break above the trend line might push the price towards the $0.0450 resistance area. It coincides with the 50% Fibonacci retracement level of the last key drop from the $0.0556 high to $0.0350 low. Any further gains could face resistance near the $0.0500 area.
On the downside, an immediate support is near the $0.0360 level. The main support is near the $0.0350 level, below which the price could resume its decline. In the mentioned bearish case, the price is likely to test the $0.0320 support level in the near term.
The chart indicates that ADA price is consolidating in a range above the $0.0350 support area. On the upside, it is facing key hurdles near the $0.0400 and $0.0420 levels. If the price struggles to clear the $0.0400 and $0.0420 resistance levels, there is a risk of more downsides below the $0.0360 and $0.0350 support levels. Conversely, it could head towards $0.0500 if there is a clear break above $0.0420.
Technical Indicators
4 hours MACD – The MACD for ADA/USD is losing momentum in the bearish zone.
4 hours RSI – The RSI for ADA/USD is currently moving higher and is likely to break the 50 level.
Key Support Levels – $0.0360 and $0.0350.
Key Resistance Levels – $0.0400 and $0.0420.
