- ADA price started a fresh increase above the $2.50 resistance against the US Dollar.
- The price is now trading near $2.75 and the 55 simple moving average (4-hours).
- There is a key bullish flag pattern forming with resistance near $2.85 on the 4-hours chart (data feed via Bitfinex).
- The price could start another strong increase if it clears the $2.90 resistance zone in the near term.
Cardano price is showing positive signs above $2.60 against the US Dollar, similar to bitcoin. ADA price must stay above $2.50 to continue higher in the near term.
Cardano Price Analysis
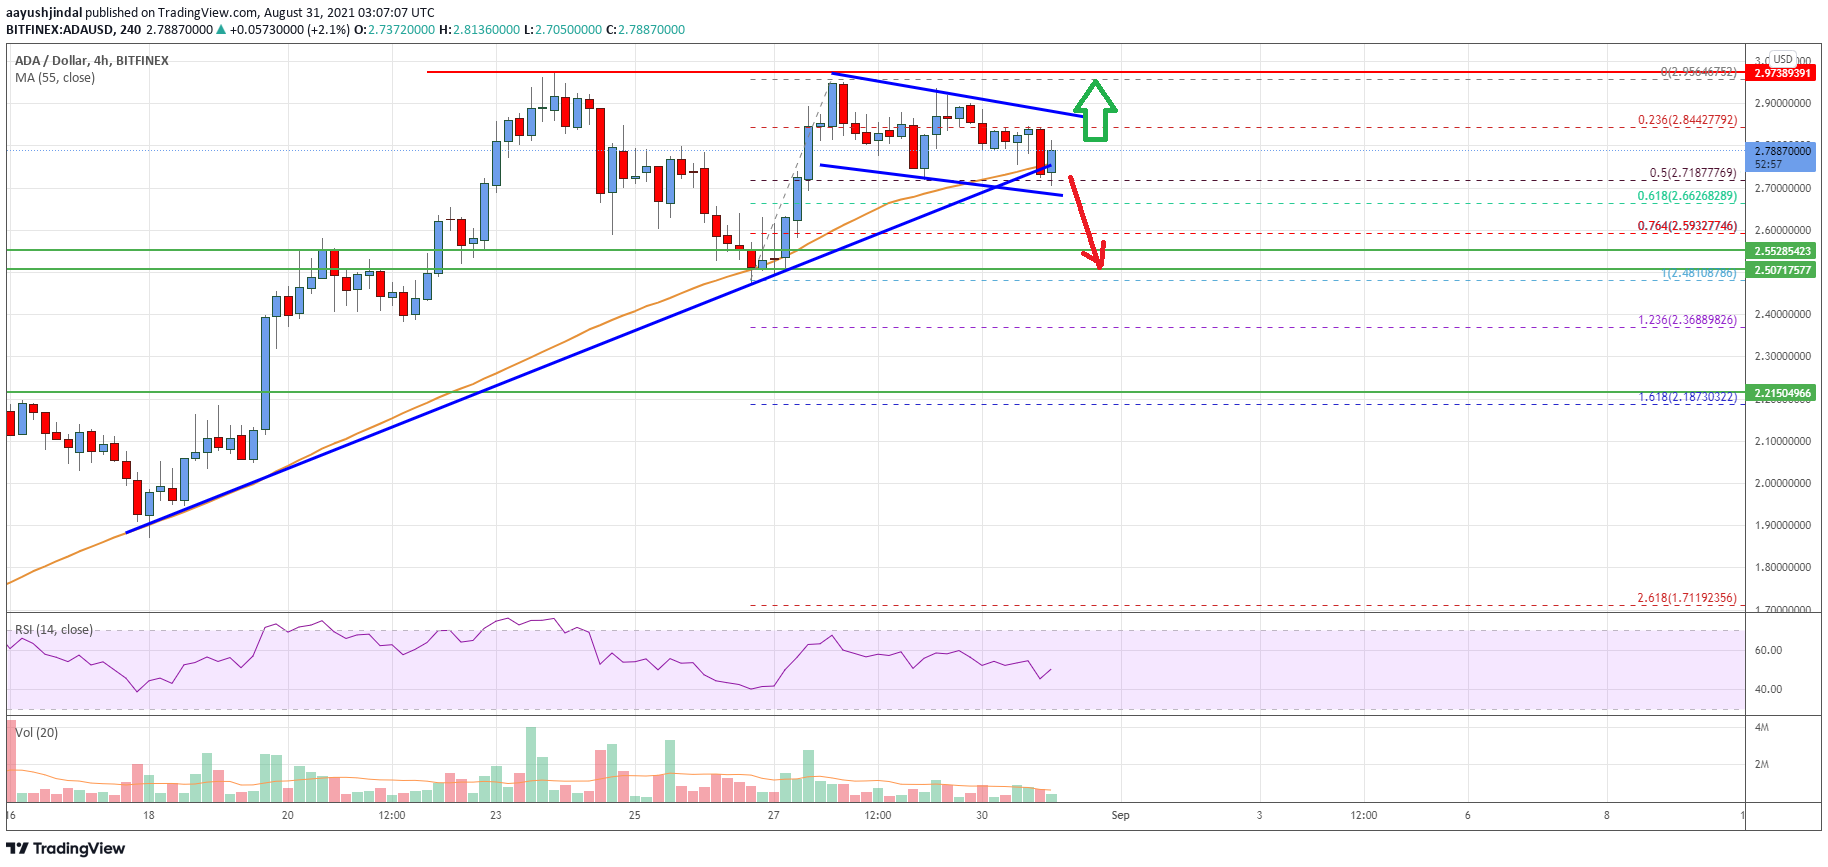
After a close above the $2.20 level, cardano price started another increase against the US Dollar. The ADA/USD pair broke the $2.70 resistance to move further into a positive zone.
The price even climbed above the $2.85 level and settled nicely above the 55 simple moving average (4-hours). Finally, there was a spike above $2.90, but the price failed again near the $2.95 zone. There was no test of the $3.00 resistance and the price corrected lower.
There was a break below the $2.90 level. It traded below the 23.6% Fib retracement level of the upward wave from the $2.48 swing low to $2.95 high.
ADA is now trading near $2.75 and the 55 simple moving average (4-hours). There is also a key bullish flag pattern forming with resistance near $2.85 on the 4-hours chart. An immediate support is near the $2.70 level. It is close to the 50% Fib retracement level of the upward wave from the $2.48 swing low to $2.95 high.
If there is a downside break below the $2.72 and $2.70 support levels, the price could revisit the $2.50 support. Any more losses might call for a sharp decline to $2.20. On the upside, the price is facing a major resistance near the $2.95 zone. If there is an upside break above the $2.95 zone, the price could rally above $3.00.

The chart indicates that ADA price is now trading near $2.75 and the 55 simple moving average (4-hours). Overall, the price could start another strong increase if it clears the $2.90 resistance zone in the near term.
Technical Indicators
4 hours MACD – The MACD for ADA/USD is still in the bullish zone.
4 hours RSI – The RSI for ADA/USD is now close to the 50 level.
Key Support Levels – $2.70 and $2.50.
Key Resistance Levels – $2.95 and $3.00.


Leave a Reply
You must be logged in to post a comment.