
- ADA price gained bullish momentum above the $0.1200 resistance area against the US Dollar.
- The price is currently consolidating gains above the $0.1250 and $0.1200 support levels.
- There is a key breakout pattern forming with support near $0.1235 on the 4-hours chart (data feed via Kraken).
- The price could continue to rise towards $0.1500 as long as it is above the $0.1200 support.
Cardano price is trading in strong bullish zone against the US Dollar and bitcoin. ADA price seems to be aiming more upsides above $0.1350 and $0.1400 in the near term.
Cardano Price Analysis
This month, cardano price gained bullish momentum and rallied more than 25% above $0.1000 against the US Dollar. The ADA/USD pair settled nicely above the $0.1200 pivot level and the 55 simple moving average (4-hours).
In the past few days, there were swing moves and corrective waves towards $0.1200. However, the price remained well bid above the $0.1200 level. The last swing high was $0.1363 and the recent low was $0.1199.
The price is currently rising and trading well above $0.1250 level. It broke the 50% Fibonacci retracement level of the recent decline from the $0.1363 high to $0.1199 low. ADA is currently facing a strong resistance near the $0.1350 level.
There is also a key breakout pattern forming with support near $0.1235 on the 4-hours chart. The triangle resistance is near the $0.1350 level. It is close to the 76.4% Fibonacci retracement level of the recent decline from the $0.1363 high to $0.1199 low.
The next major resistance is near the $0.1400 level, above which the bulls are likely to aim a test of the $0.1500 level in the near term. Any further gains could lead the price towards $0.1580.
Conversely, the price could break the triangle support, the 55 simple moving average (4-hours), and the main $0.1200 support. In the mentioned case, there is a risk of a sharp decline towards the $0.1050 and $0.1000 levels in the coming sessions.
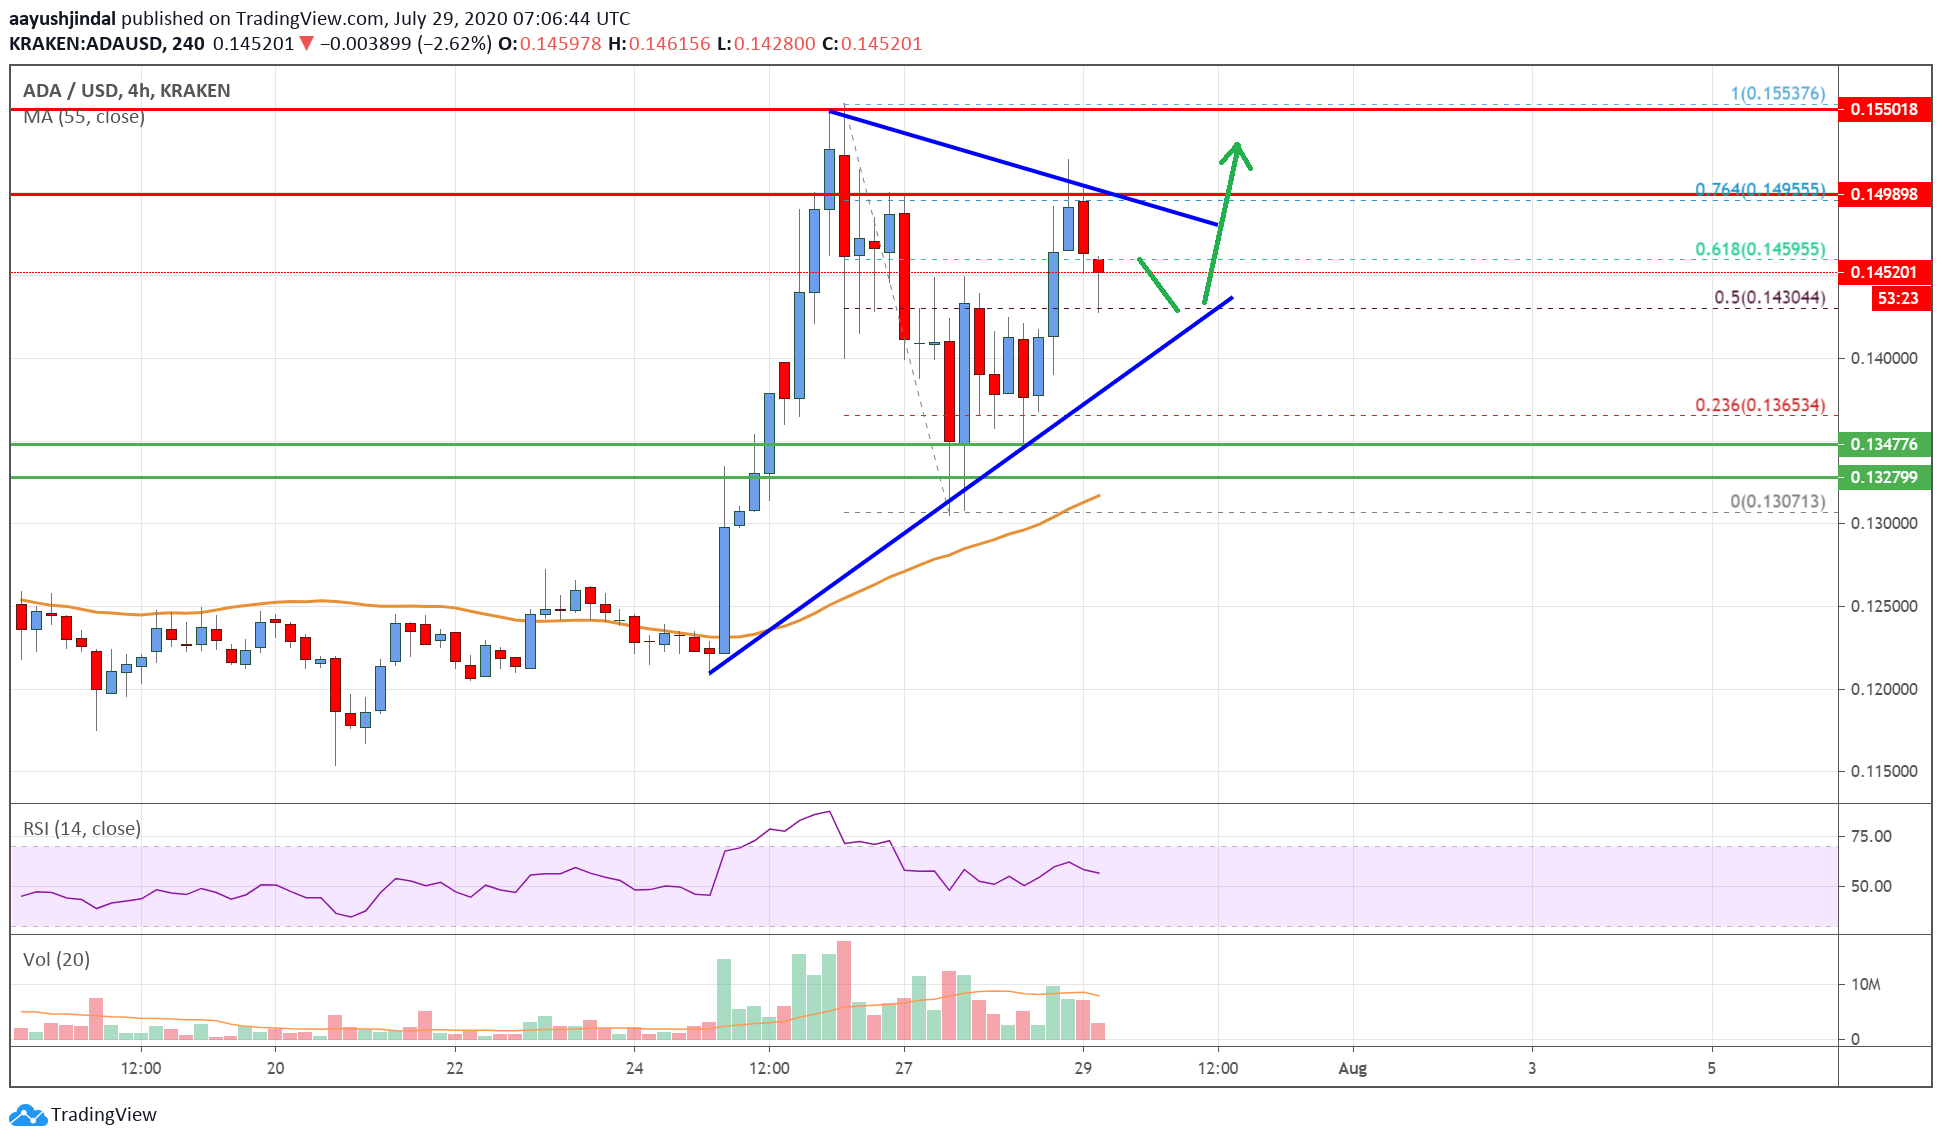
The chart indicates that ADA price is clearly trading in a positive zone above the $0.1200 support. Therefore, it could continue to rise towards $0.1500 as long as it is above the $0.1200 support.
Technical Indicators
4 hours MACD – The MACD for ADA/USD is currently losing pace in the bullish zone.
4 hours RSI – The RSI for ADA/USD is now well above the 50 level.
Key Support Levels – $0.1235 and $0.1200.
Key Resistance Levels – $0.1350 and $0.1400.


Leave a Reply
You must be logged in to post a comment.