
- ADA price is gaining bullish momentum above the$0.0526 resistance area against the US Dollar.
- The price traded as high as $0.0570 and it is currently trading in a strong uptrend.
- There was a break above a short term contracting triangle with resistance near $0.0521 on the 4-hours chart (data feed via Kraken).
- The price is likely to continue higher towards the $0.0585 and $0.0600 resistance levels in the near term.
Cardano price is trading with a bullish bias above $0.0525 against the US Dollar, similar to bitcoin. ADA price could soon test $0.0600 and it might even rally further.
Cardano Price Analysis
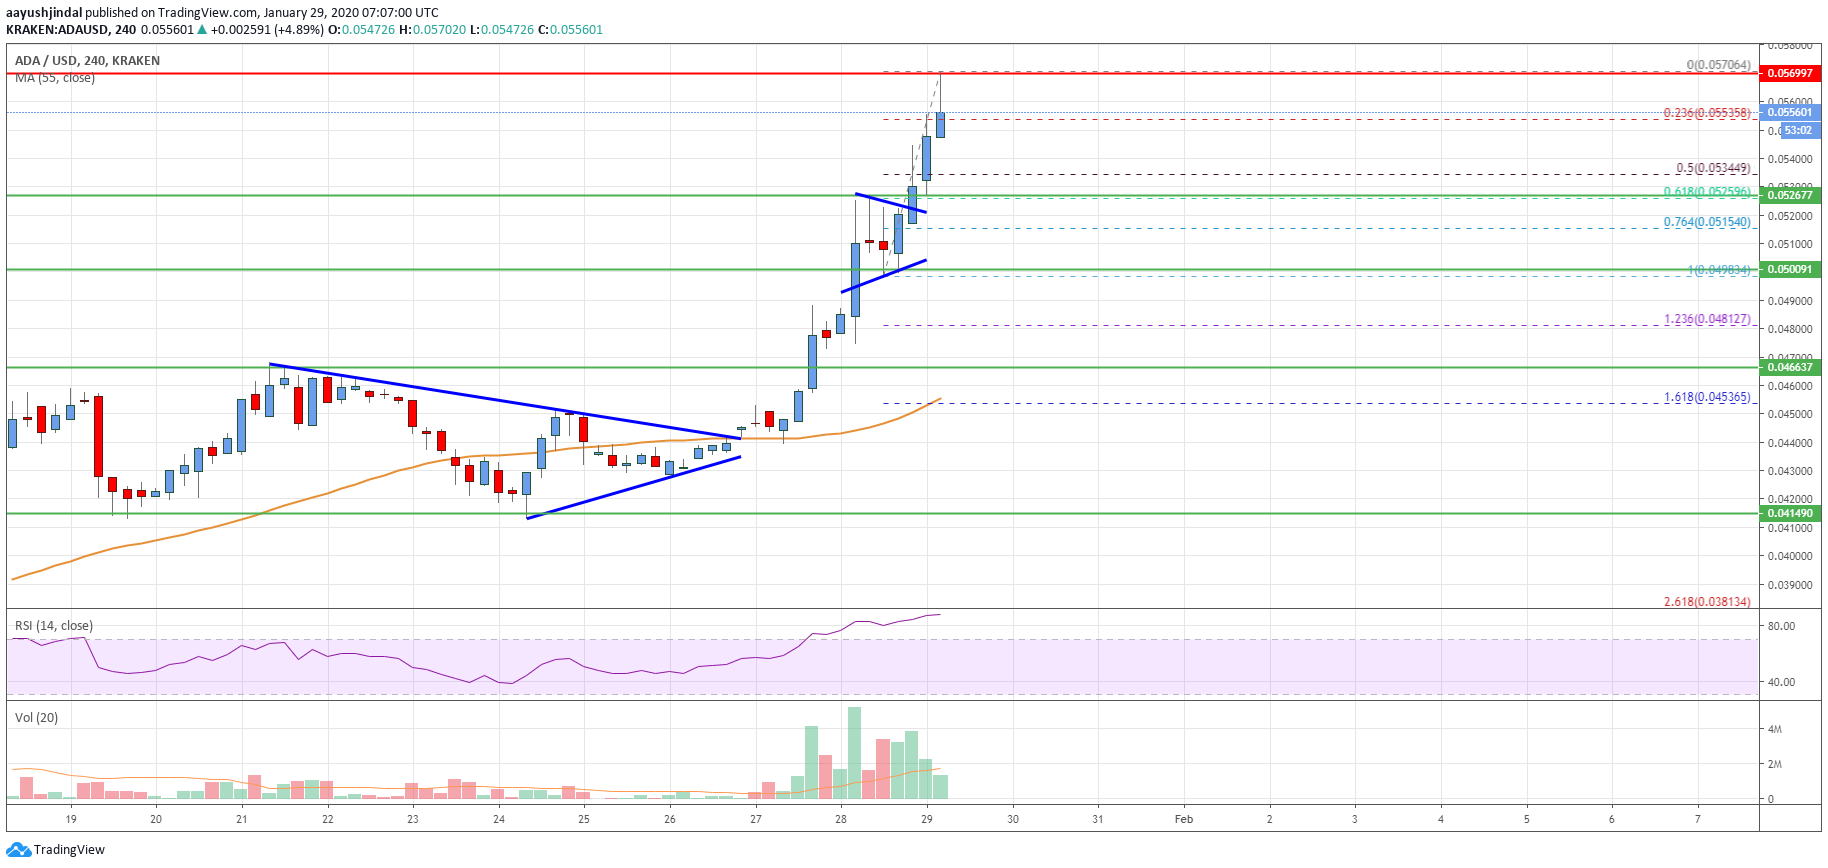
In the past few days, cardano price remained in a steady uptrend above the $0.0420 support against the US Dollar. The ADA/USD pair even settled above the $0.0450 pivot level and the 55 simple moving average (4-hours).
During the rise, the price cleared a key bearish trend line with resistance at $0.0440. Moreover, there was a clear break above the $0.0505 and $0.0526 resistance levels.
It opened the doors for more gains and recently there was a break above a short term contracting triangle with resistance near $0.0521 on the 4-hours chart. The pair traded above the $0.0560 level and traded to a new yearly high at $0.0570.
It is currently showing a lot of positive signs, with supports near the $0.0550 level. It coincides with the 23.6% Fibonacci retracement level of the recent gain from the $0.0498 low to $0.0570 high.
The first key support is near the $0.0535. Moreover, the 50% Fibonacci retracement level of the recent gain from the $0.0498 low to $0.0570 high is near the $0.0535 level. Any further losses may perhaps lead the price towards the $0.0526 pivot level.
If the bulls fail to protect $0.0526, cardano price might slide towards the $0.0500 support. On the upside, an initial resistance is near the $0.0570 level.
If there is a clear break above $0.0570, the price is likely to accelerate towards the $0.0585 and $0.0600 resistance levels. Any further gains could lead the price towards $0.0615 and $0.0620 in the near term.
The chart indicates that ADA price is trading in a strong uptrend above $0.0526 and $0.0535. In the short term, there could be a minor pullback, but the price is likely to revisit the $0.0600 area in the coming days.
Technical Indicators
4 hours MACD – The MACD for ADA/USD is slowly losing momentum in the bullish zone.
4 hours RSI – The RSI for ADA/USD is currently well above the 70 level.
Key Support Levels – $0.0535 and $0.0526.
Key Resistance Levels – $0.0570 and $0.0600.


Leave a Reply
You must be logged in to post a comment.