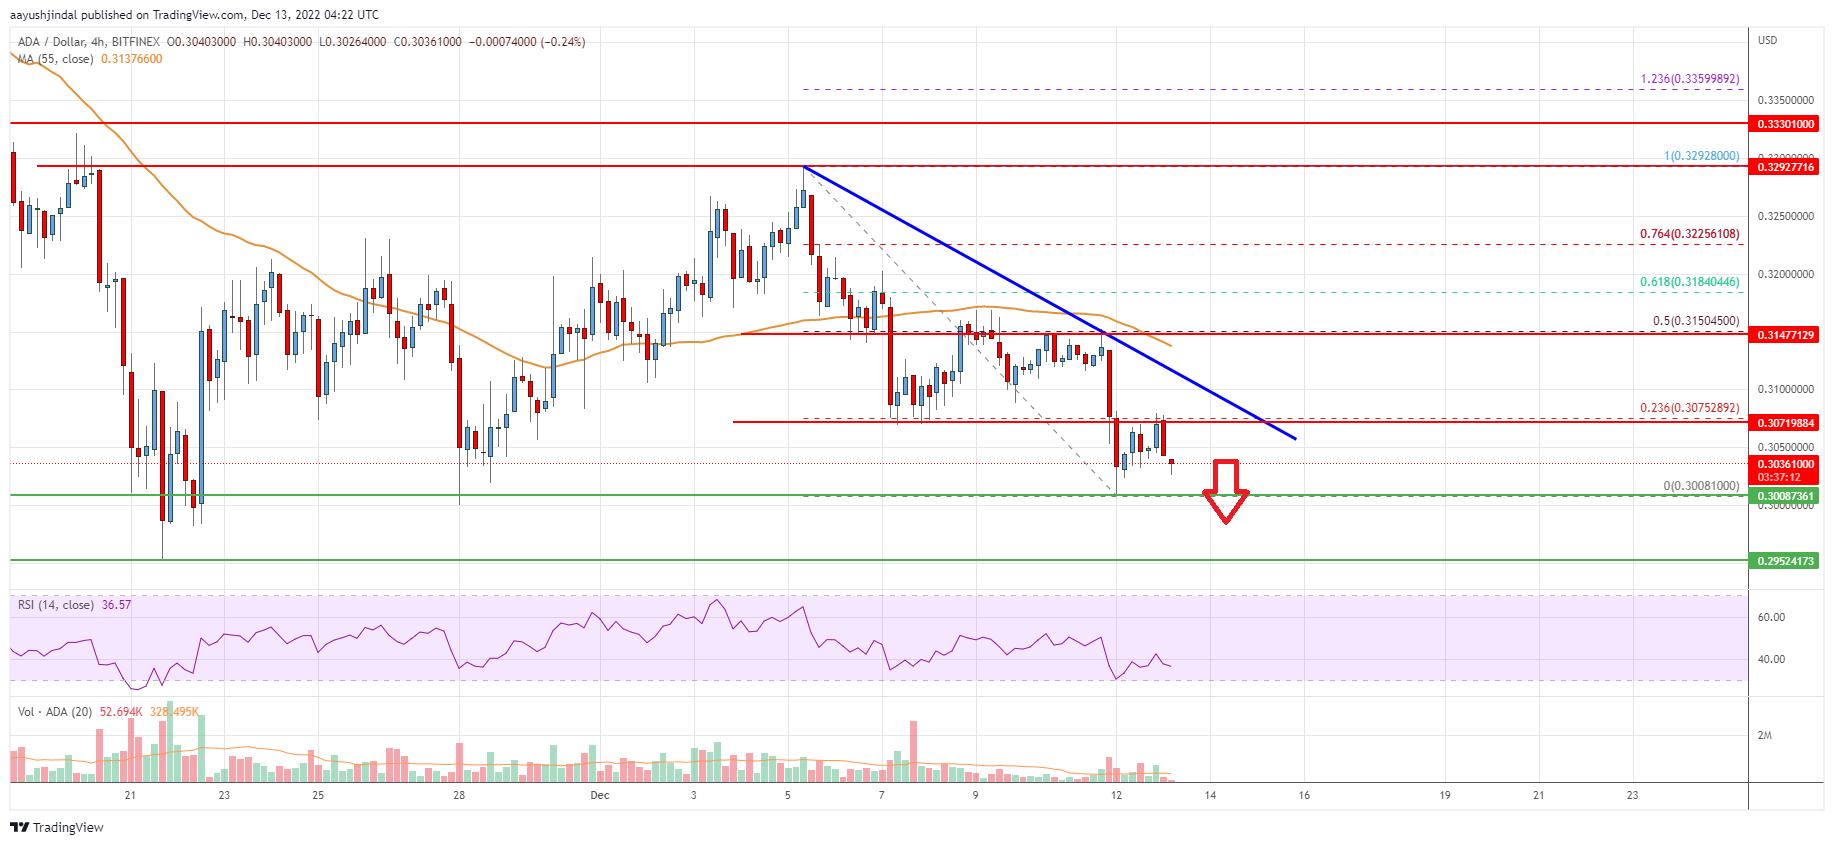
- ADA price is signaling a bearish bias below the $0.32 support zone against the US Dollar.
- The price is now trading below $0.320 and the 55 simple moving average (4-hours).
- There is a key bearish trend line forming with resistance near $0.308 on the 4-hours chart (data feed via Bitfinex).
- The price could continue to move down if it stays below the $0.315 resistance zone.
Cardano price is struggling below $0.315 against the US Dollar, similar to bitcoin. ADA price must stay above the $0.295 support to avoid more downsides.
Cardano Price Analysis
This past week, cardano price saw a fresh decline from the $0.330 zone against the US Dollar. The ADA/USD pair declined below the $0.320 and $0.308 support levels.
The price even declined below the $0.305 support and the 55 simple moving average (4-hour). A low was formed near $0.3008 and the price is now consolidating losses. On the upside, an immediate resistance is near the $0.308 zone.
There is also a key bearish trend line forming with resistance near $0.308 on the 4-hours chart. The trend line is near the 23.6% Fib retracement level of the downward move from the $0.3292 swing high to $0.3008 low.
The first major resistance is near the $0.315 level and the 55 simple moving average (4-hours) or the 50% Fib retracement level of the downward move from the $0.3292 swing high to $0.3008 low, above which the price might recover.
The next major resistance is near the $0.350 zone. A clear upside break above the $0.350 level might send the price towards the $0.388 resistance. Any more gains could start a steady increase towards the $0.400 level.
On the downside, an immediate support is near the $0.300 level. The next major support is near the $0.295 level, below which the price may perhaps decline towards the $0.262 support level. Any more losses might call for a test of the $0.250 level.

The chart indicates that ADA price is now trading below $0.312 and the 55 simple moving average (4-hours). Overall, the price could continue to move down if it fails to surpass the $0.315 resistance zone.
Technical Indicators
4 hours MACD – The MACD for ADA/USD is now gaining pace in the bearish zone.
4 hours RSI – The RSI for ADA/USD is now below the 50 level.
Key Support Levels – $0.300 and $0.295.
Key Resistance Levels – $0.315 and $0.330.


Leave a Reply
You must be logged in to post a comment.