
- Ethereum price is showing positive signs above the $1,220 level against the US Dollar.
- ETH price is now trading above $1,230 and the 55 simple moving average (4-hours).
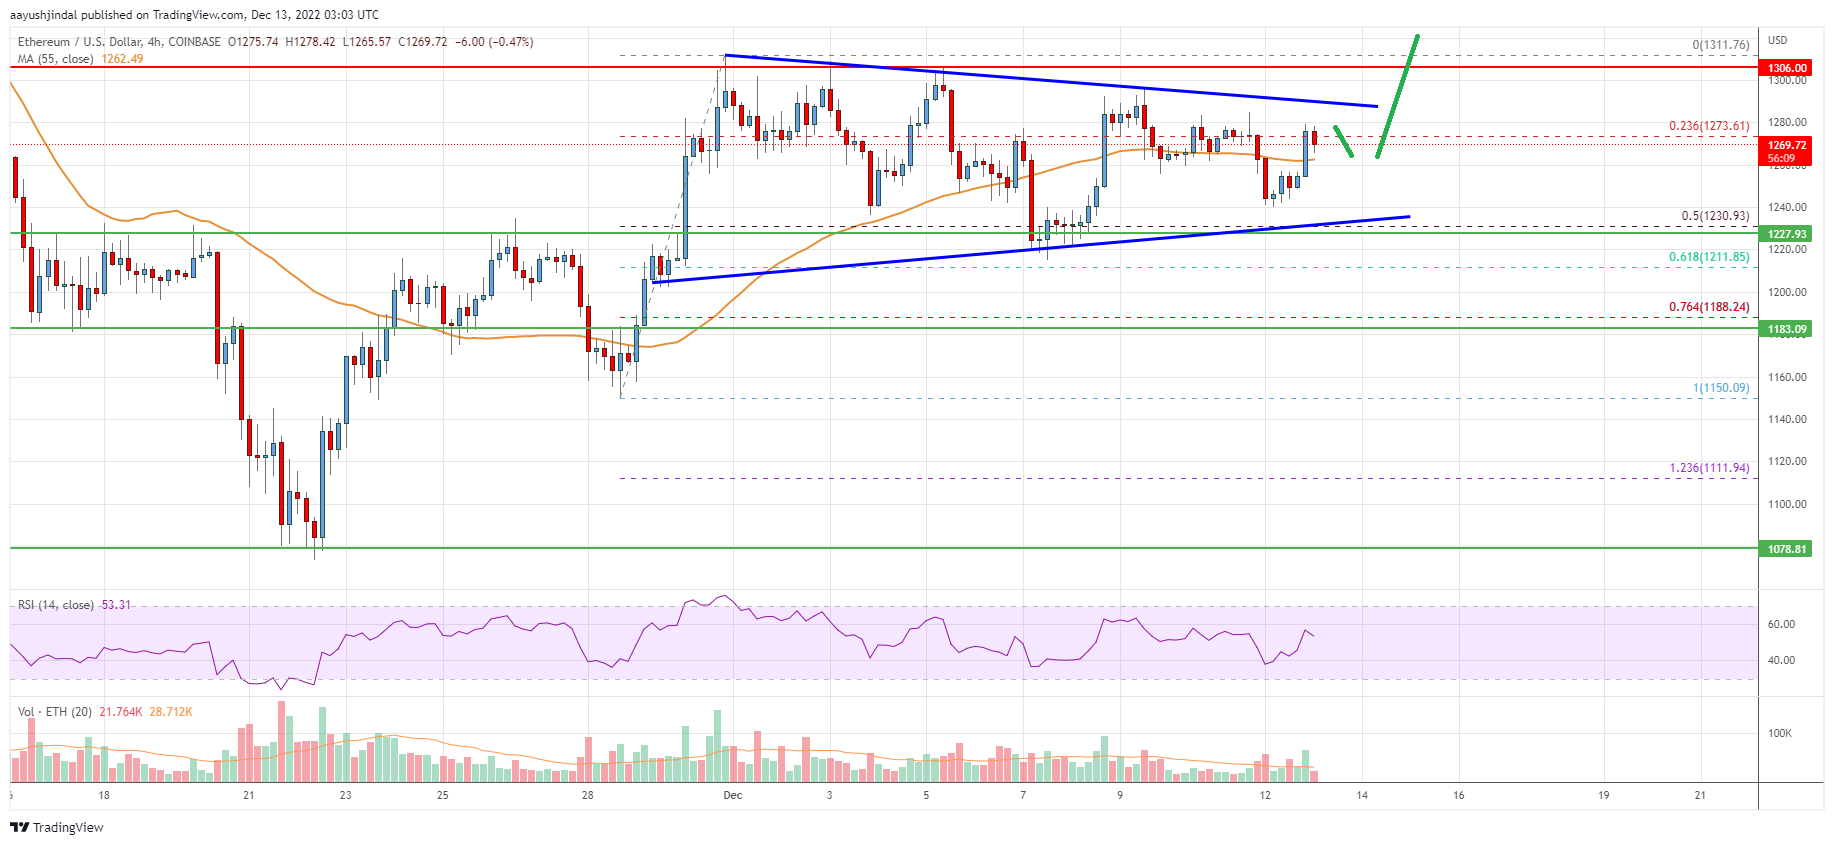
- There is a major contracting triangle forming with resistance near $1,290 on the 4-hours chart (data feed from Coinbase).
- The pair could climb further if it clears the $1,290 resistance zone.
Ethereum price is rising above the $1,220 level against the US Dollar. ETH/USD could rise further if it clears the $1,290 resistance zone.
Ethereum Price Analysis
In the past few days, ethereum saw a decent increase above the $1,200 level against the US Dollar. ETH price was able to gain pace for a move above the $1,230 level and the 55 simple moving average (4-hours).
The bulls even cleared the $1,250 resistance zone. However, they struggled to clear the $1,300 and $1,310 resistance levels. There was a downside correction below the $1,260 level. The price declined below the 23.6% Fib retracement level of the upward move from the $1,151 swing low to $1,310 high.
On the downside, the price found support near the $1,230 zone. It remained stable above the 50% Fib retracement level of the upward move from the $1,151 swing low to $1,310 high.
The price is now rising above $1,230 and the 55 simple moving average (4-hours). An immediate resistance on the upside is near the $1,280 level. The next major resistance is near the $1,290 zone. Any more gains could even send the price towards the $1,400 resistance zone in the near term.
On the downside, an initial support is near the $1,250 level. The next major support is now near the $1,230 level and the triangle lower trend line. A break below the $1,230 support could push the price to $1,185. Any more losses could lead the price towards $1,120 or even $1,070 in the coming days.
Looking at the chart, Ethereum price is clearly trading above the $1,230 zone and the 55 simple moving average (4-hours). Overall, ether price could climb further if it clears the $1,290 resistance zone.
Technical indicators
4 hours MACD – The MACD for ETH/USD is now gaining momentum in the bullish zone.
4 hours RSI (Relative Strength Index) – The RSI for ETH/USD is now above the 50 level.
Key Support Levels – $1,250, followed by the $1,230 zone.
Key Resistance$ Levels – $1,290 and $1,310.


Leave a Reply
You must be logged in to post a comment.