- ADA price declined heavily after it failed to break the $0.0800 resistance against the US Dollar.
- The price declined sharply and broke the $0.0750 and $0.0720 support levels.
- There is a key connecting bearish trend line in place with resistance at $0.0765 on the 4-hours chart (data feed via Kraken).
- The price could correct higher, but the $0.0750 and $0.0765 levels are likely to cap upsides.
Cardano price declined heavily below key supports against the US Dollar and bitcoin. ADA is currently trading near $0.0700 and it could correct higher towards $0.0750 in the near term.
Cardano Price Analysis
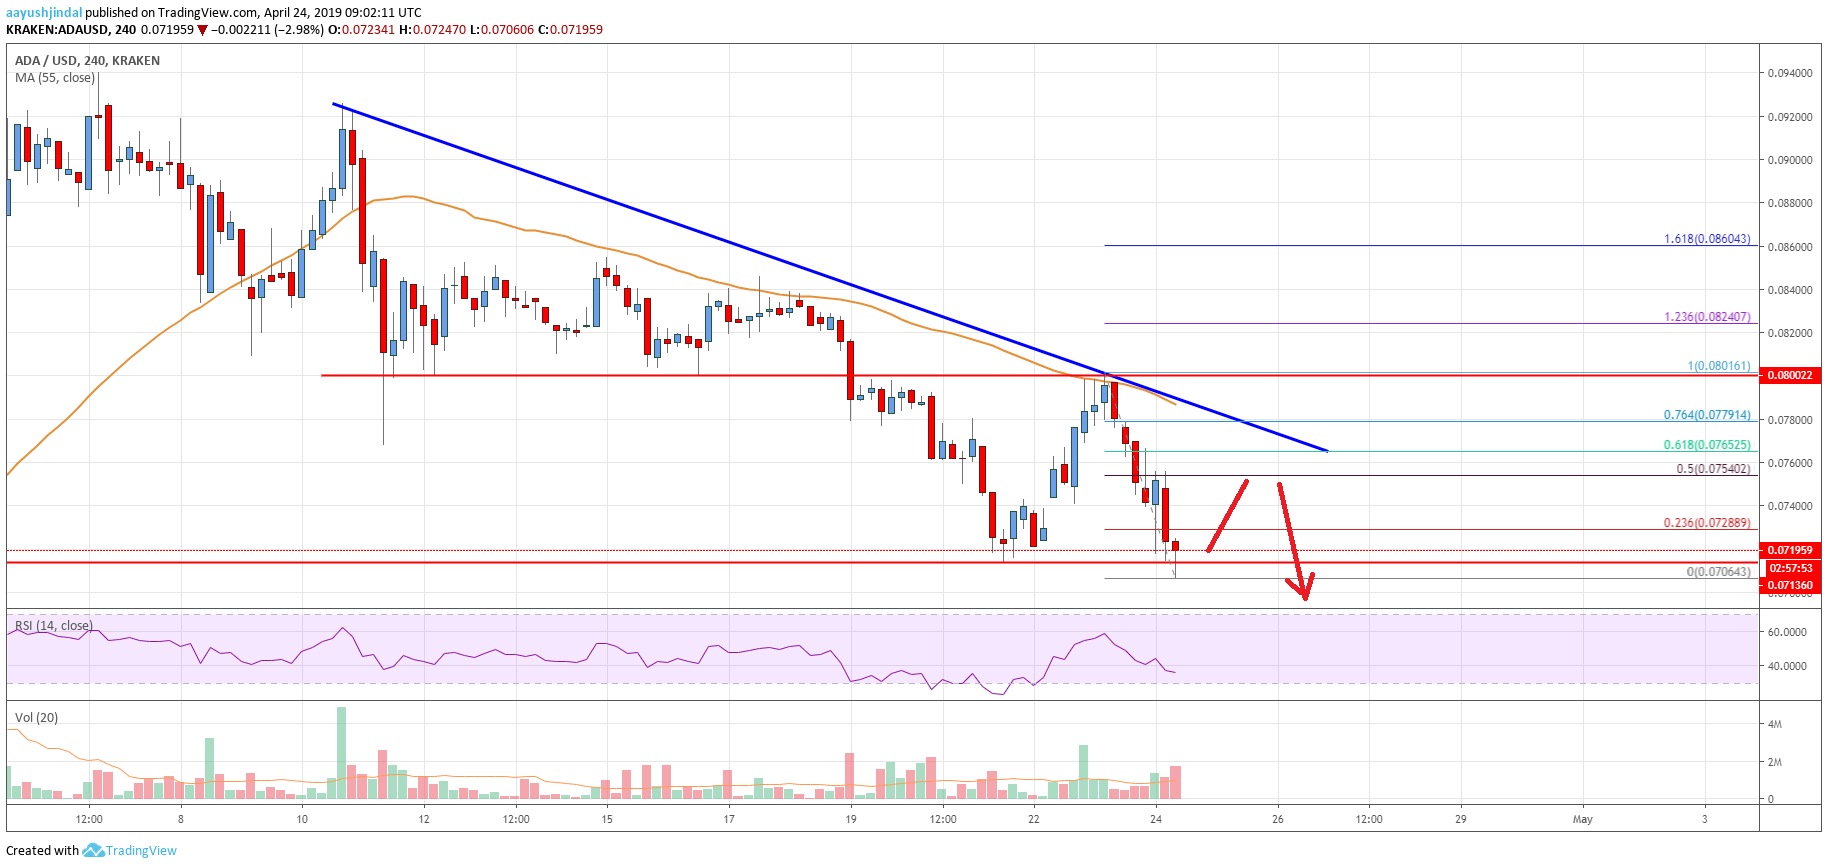
This past week, there was a sharp dip in cardano price below the $0.0800 support against the US Dollar. The ADA/USD pair declined below the $0.0750 and $0.0720 support levels. It tested the $0.0700 support area and recently rebounded above $0.0750. However, the same $0.0800 level acted as a strong resistance along with the 55 simple moving average (4-hours). As a result, there was a fresh decline below $0.0750 and $0.0720 support levels.
The price recently retest the $0.0700 support level and traded as low as $0.0706. It is currently trading with a bearish bias, but there could be a short term correction above $0.0720. An initial resistance is near the $0.0730 level and the 23.6% Fibonacci retracement level of the recent drop from the $0.0801 high to $0.0706 low. The next key resistance is near the $0.0750 and $0.0755 levels. The 50% Fibonacci retracement level of the recent drop from the $0.0801 high to $0.0706 low is also near the $0.0750 level.
Besides, there is a key connecting bearish trend line in place with resistance at $0.0765 on the 4-hours chart. Therefore, if the price corrects higher, the $0.0750 and $0.765 levels are likely to act as strong resistances in the near term. On the downside, the main support is at $0.0700. If there is a downside break, the price could accelerate losses towards the $0.0680 and $0.0665 levels.

The chart indicates that ADA price is clearly trading in a downtrend below the $0.0800 pivot level and the 55 simple moving average (4-hours). As long as the price is below $0.0800, any recovery is likely to face sellers near $0.0750 or $0.0765. On the downside, the price may test the $0.0680 level before starting a substantial rebound in the coming days.
Technical Indicators
4 hours MACD – The MACD for ADA/USD is gaining momentum in the bearish zone, with no positive signs.
4 hours RSI – The RSI for ADA/USD is now well below the 40 level and it might decline towards the 25 level.
Key Support Levels – $0.0700 and $0.0680.
Key Resistance Levels – $0.0750 and $0.0765.


Leave a Reply
You must be logged in to post a comment.