- ADA price corrected lower, but the $0.0860 level acted as a strong support against the US Dollar.
- The price is currently trading well above $0.0900 and it is likely to climb further higher in the near term.
- There is a breakout pattern forming with resistance near $0.0921 on the 4-hours chart (data feed via Kraken).
- The price is likely to start a solid upward move once it clears $0.0925 and $0.0930.
Cardano price is showing a lot of positive signs against the US Dollar, but struggling vs bitcoin. ADA is likely to surge towards $0.1000 once it clears the $0.0925 and $0.0930 resistances.
Cardano Price Analysis
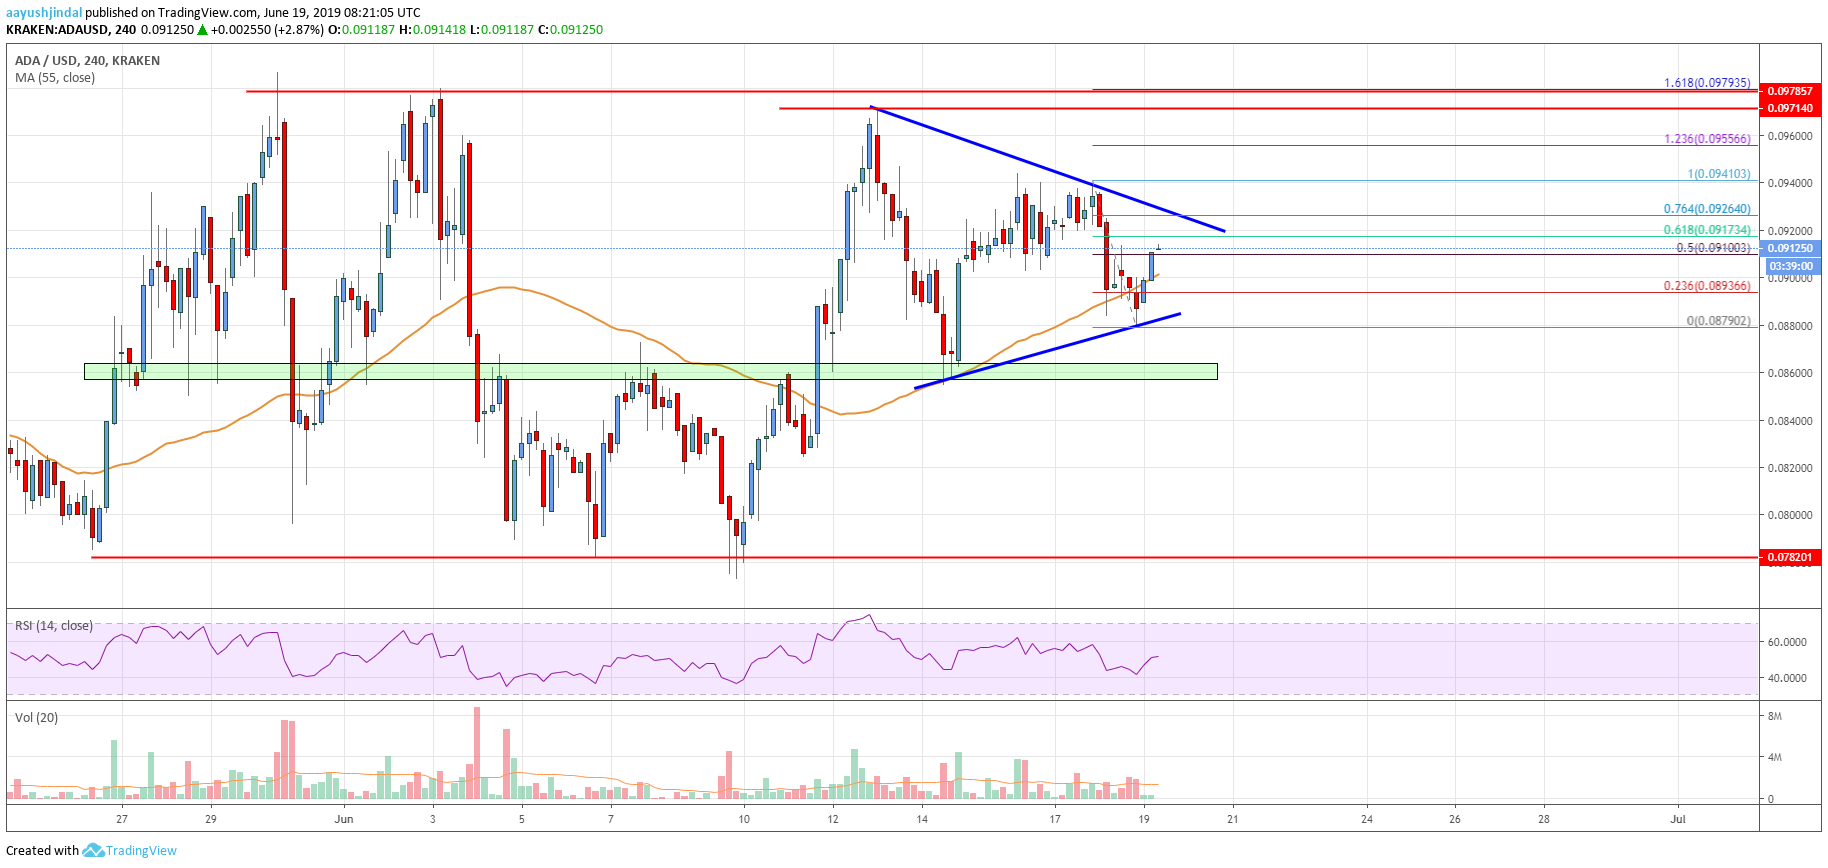
After struggling near the $0.0970 level, cardano price started a strong decline against the US Dollar. The ADA/USD pair broke the $0.0900 support level, but it stayed above the 55 simple moving average (4-hours). The $0.0860 level acted as a crucial buy zone. A swing low was formed at $0.0860 and the price recently climbed above $0.0920.
A swing high was formed at $0.0941 and the price recently corrected lower. It traded below the $0.0900 level and formed a low at $0.0879. It is currently trading higher above the $0.0900 level and the 23.6% Fibonacci retracement level of the last decline from the $0.0941 high to $0.0879 low. At the moment, the $0.0910 and $0.0912 levels are acting as hurdles.
Moreover, the 50% Fibonacci retracement level of the last decline from the $0.0941 high to $0.0879 low is acting as a resistance. Additionally, there is a breakout pattern forming with resistance near $0.0921 on the 4-hours chart. Therefore, a successful break above $0.0921 and $0.0925 is likely to open the doors for more gains.
An immediate resistance is near the 0.0930 level, above which the price could retest the $0.0970 resistance zone. On the downside, the $0.0890 level and the 55 simple moving average (4-hours) are crucial supports. If there is a downside break below the $0.0890 support and $0.0880 swing low, there are chances of more losses.

The chart indicates that ADA price is currently with a positive bias above the $0.0900 support level. The current price action seems bullish, with chances of an upside break above the $0.0925 resistance. However, the main resistance is near $0.0970 for a larger upward move above the $0.1000 barrier. On the downside, the most important support is near the $0.0860 level.
Technical Indicators
4 hours MACD – The MACD for ADA/USD is currently gaining momentum in the bullish zone.
4 hours RSI – The RSI for ADA/USD climbed back above the 50 level and it could continue to rise towards 55 and 60.
Key Support Levels – $0.0880 and $0.0860.
Key Resistance Levels – $0.0925 and $0.0970.


Leave a Reply
You must be logged in to post a comment.