- ADA price remained in a major downtrend and broke the $0.0380 support level against the US Dollar.
- There are two key bearish trend lines formed with resistance at $0.0368 and $0.0382 on the 4-hours chart (data feed via Kraken).
- The price could correct a few points, but it is likely to struggle near the $0.0370 and $0.0385 resistances.
Cardano price declined heavily recently against the US Dollar and Bitcoin. ADA tested the $0.0355 level and it remains in a significant downtrend below the $0.0385 resistance.
Cardano Price Analysis
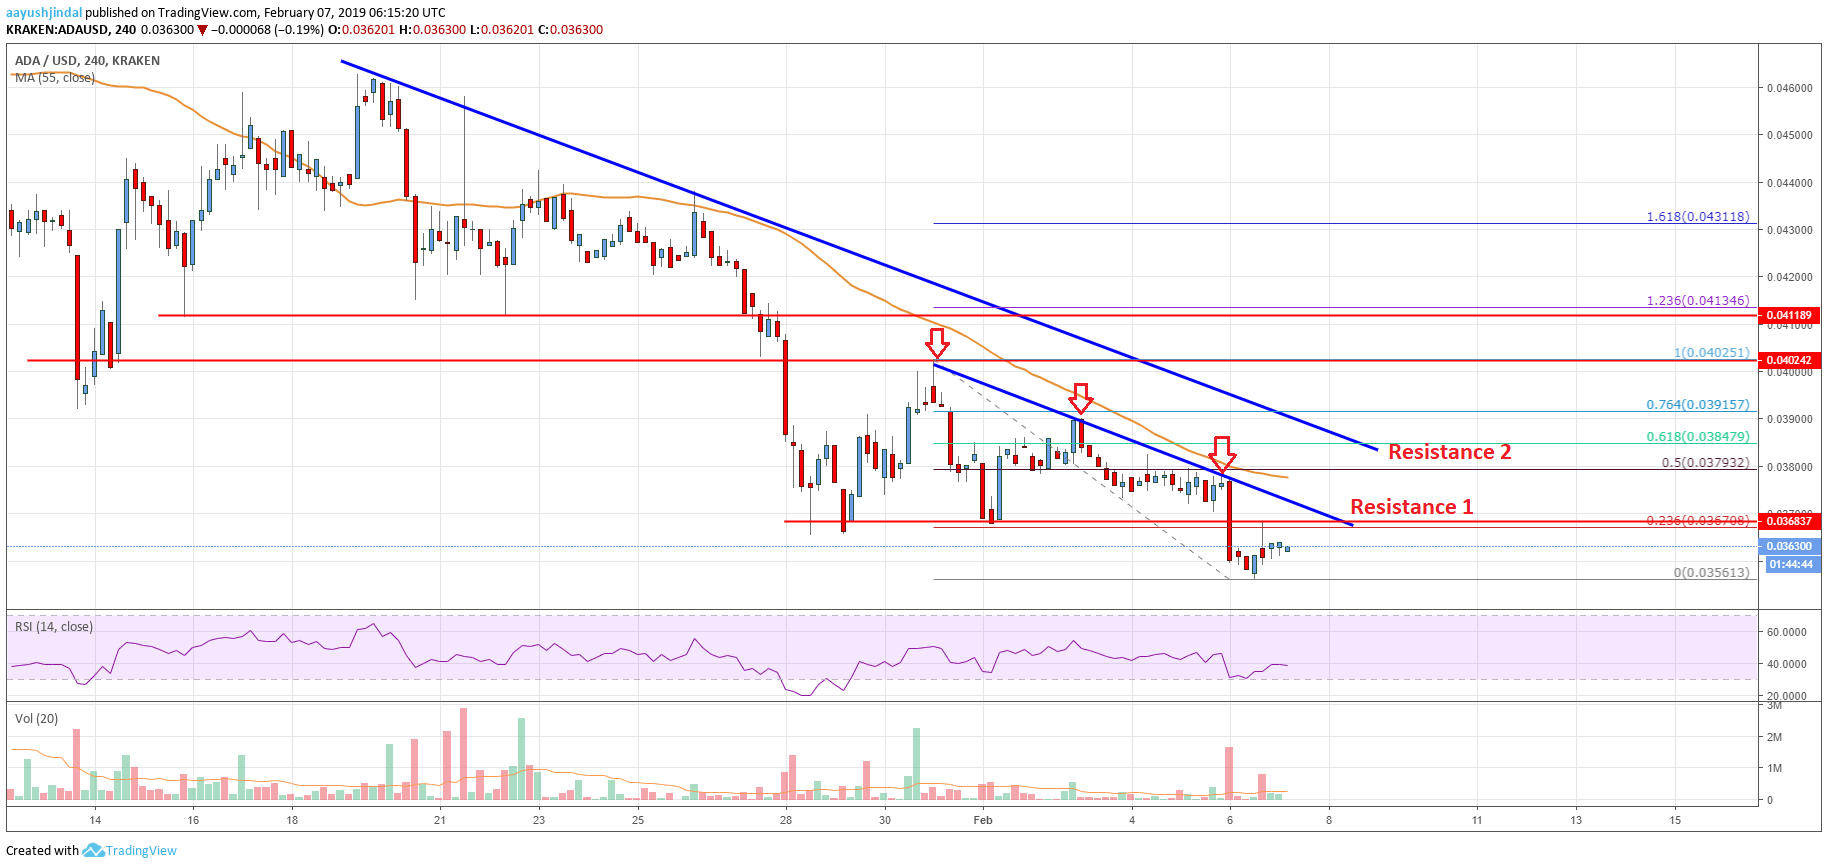
In the last analysis, we discussed a few important resistances near $0.0400 in cardano price against the US Dollar. The ADA/USD pair corrected a few points, but the $0.0400 level acted as a solid resistance. As a result, there was a fresh decline and the price broke the $0.0380 and $0.0365 support levels. The price even broke the $0.0360 support and settled below the 55 simple moving average (4-hours). A new yearly low was formed at $0.0356 and it seems like the price is trading in a strong downtrend.
An initial resistance is the 23.6% Fibonacci retracement level of the recent drop from the $0.0402 high to $0.0356 low. More importantly, there are two key bearish trend lines formed with resistance at $0.0368 and $0.0382 on the 4-hours chart. An intermediate resistance is the 50% Fibonacci retracement level of the recent drop from the $0.0402 high to $0.0356 low. Therefore, if the price corrects above the $0.0368 and $0.0370 levels, it could face a strong resistance near $0.0380 and $0.0385. As long as the price is trading below $0.0385 and the 55 simple moving average (4-hours), it remains in a downtrend.

The chart indicates that ADA price is facing a lot of hurdles on the upside near the $0.0370 and $0.0385 resistances. If it fails to climb above $0.0385, there is a risk of more losses. An initial support is at $0.0356, below which the price could test $0.0320.
Technical Indicators
4-hours MACD – The MACD for ADA/USD is placed nicely in the bearish zone.
4-hours RSI – The RSI for ADA/USD is currently well below the 50 level, with a bearish angle.
Key Support Level – $0.0356
Key Resistance Level – $0.0385


Leave a Reply
You must be logged in to post a comment.