- EOS price is facing a lot of hurdles on the upside near the $3.400 and $3.500 levels against the US Dollar.
- The price is struggling to stay above the $3.250 support and it could decline in the near term.
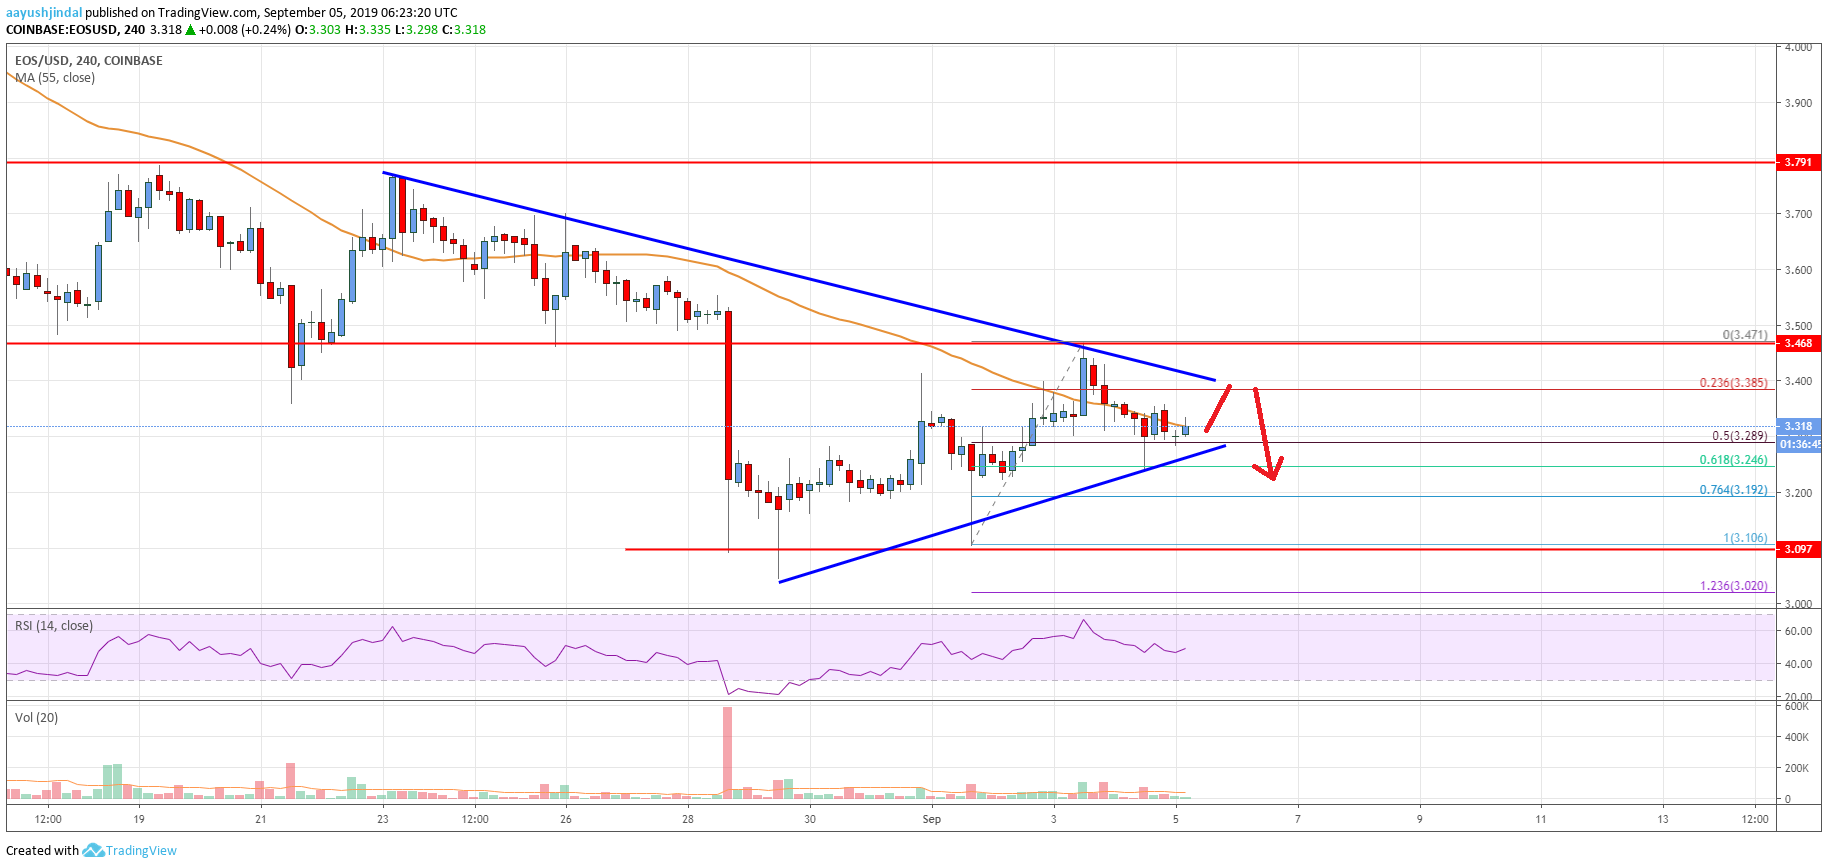
- There is a contracting triangle forming with resistance near $3.400 on the 4-hours chart of the EOS/USD pair (data feed from Coinbase).
- The pair is likely to resume its decline if it continues to struggle near $3.400 and $3.500.
EOS price is trading below key supports against the US Dollar and bitcoin. Therefore, there are high chances of more downsides below the $3.10 and $3.00 supports.
EOS Price Analysis
Recently, there was a decent correction in bitcoin, Ethereum, ripple, litecoin and EOS against the US Dollar. EOS price climbed higher and traded above the $3.300 resistance level. Moreover, the price was able to surpass the $3.400 resistance and the 55 simple moving average (4-hours). However, the price faced a strong resistance near the $3.480-$3.500 area (the previous support zone).
A swing high was formed near $3.471 and recently the price corrected lower. It broke the $3.400 level plus the 23.6% Fib retracement level of the upward move from the $3.108 low to $3.471 high. The recent decline was such that the price traded below the $3.300 support and the 55 simple moving average (4-hours). Additionally, there was a spike below the 50% Fib retracement level of the upward move from the $3.108 low to $3.471 high.
However, the $3.25 level acted as a support along with the 61.8% Fib retracement level of the upward move from the $3.108 low to $3.471 high. At the moment, there is a contracting triangle forming with resistance near $3.400 on the 4-hours chart of the EOS/USD pair. Therefore, the price seems to be preparing for the next key break either above $3.400 or below $3.250.
On the upside, a successful close above $3.400 and $3.500 is needed for a sustained move higher. The next major resistance is near the $3.800 level. Conversely, a downside break below the $3.250 support might start a strong decline. An immediate support below $3.250 is at $3.200, below which the price could decline towards $3.000.
Looking at the chart, EOS price is clearly struggling to climb above the $3.400 and $3.500 resistance levels. Therefore, there is a risk of a downside break below $3.250 as long as the price is below $3.500.
Technical indicators
Hourly MACD – The MACD for EOS/USD is gaining momentum in the bearish zone.
Hourly RSI (Relative Strength Index) – The RSI is currently just below the 50 level, with a flat structure.
Major Support Levels – $3.250 and $3.100.
Major Resistance Levels – $3.400 and $3.500.
