
- Ripple price extended its decline and traded below the $0.2650 support against the US dollar.
- The price is currently holding the $0.2460 support level and is preparing for the next move.
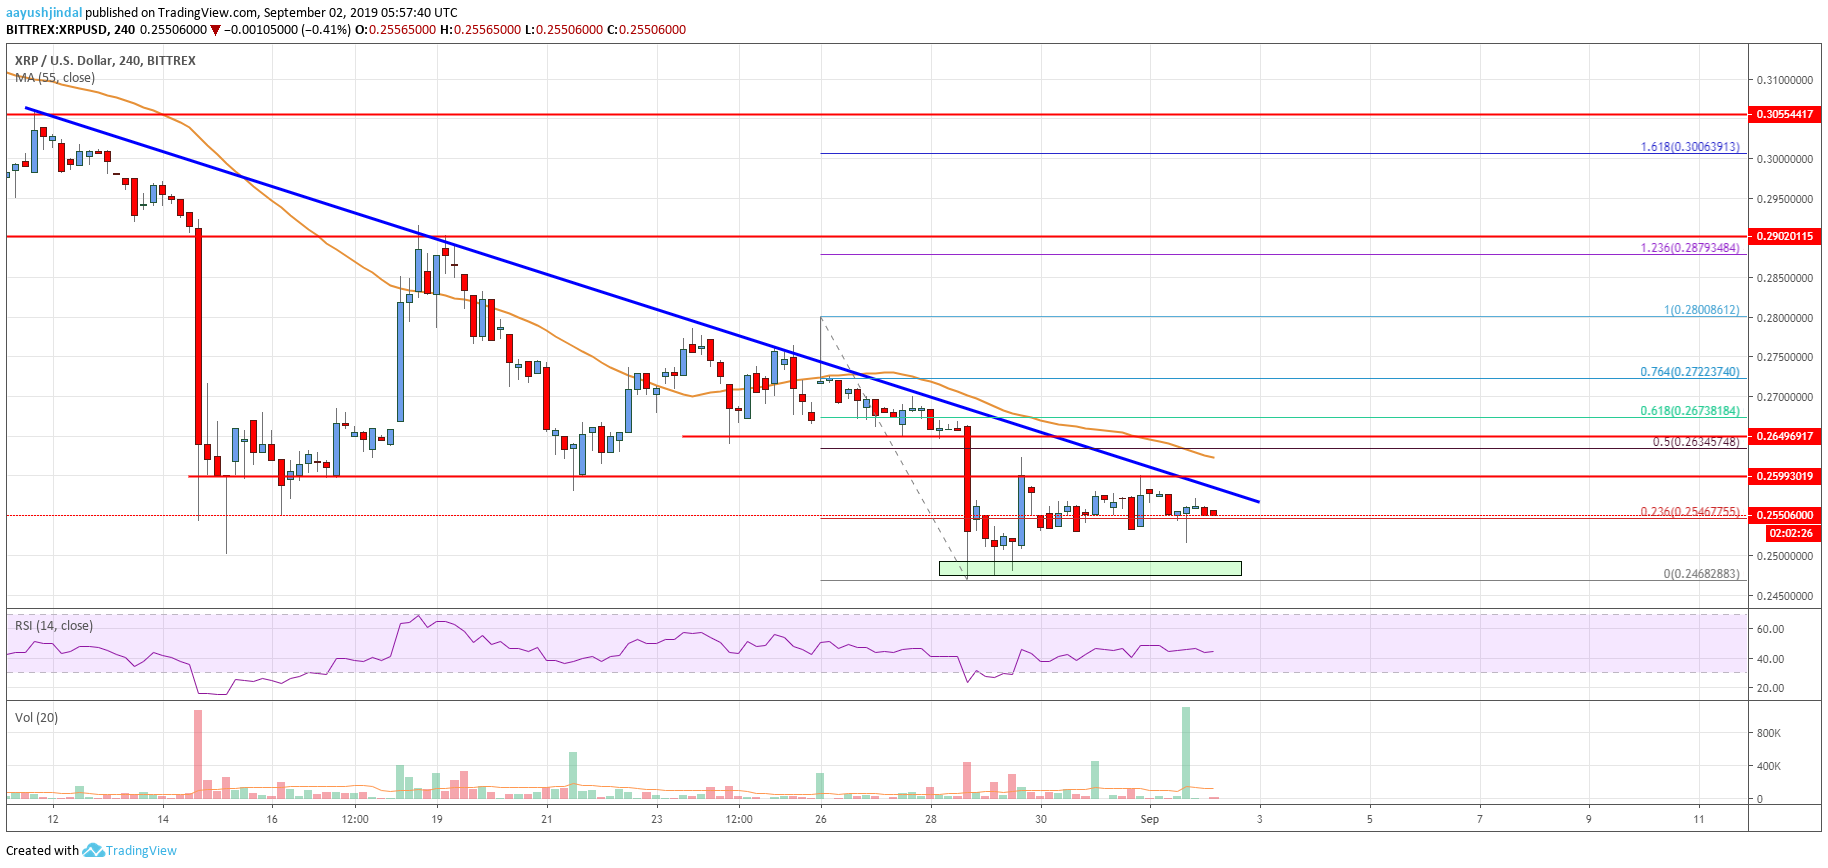
- There is a crucial bearish trend line forming with resistance near $0.2580 on the 4-hours chart of the XRP/USD pair (data source from Bittrex).
- The price could either climb above $0.2600 or it might continue to decline towards $0.2400.
Ripple price is trading below a few key resistances near $0.2600 against the US Dollar. XRP price is currently preparing for the next key break either above $0.2600 or below $0.2460.
Ripple Price Analysis
This past week, there were additional downsides in bitcoin, Ethereum, bitcoin cash, EOS and ripple against the US Dollar. The XRP/USD pair failed to hold a couple of important supports near $0.2650 and $0.2640. Moreover, there was a break below the $0.2600 support and the 55 simple moving average (4-hours). It opened the doors for more downsides below the $0.2520 support level.
The price traded to a new multi-week low at $0.2468 and it is currently correcting higher. It traded above the $0.2520 and $0.2550 resistance levels. Moreover, there was a break above the 23.6% Fib retracement level of the recent decline from the $0.2800 high to $0.2468 low. However, the price is facing a strong resistance near the $0.2600 level (the previous support).
More importantly, there is a crucial bearish trend line forming with resistance near $0.2580 on the 4-hours chart of the XRP/USD pair. The next key resistance is near the $0.2620 level and the 55 simple moving average (4-hours). Moreover, the 50% % Fib retracement level of the recent decline from the $0.2800 high to $0.2468 low is also near the $0.2630 level to act as a resistance.
If there is a successful break above the $0.2630 resistance and a close above the 55 simple moving average (4-hours), the price could start a decent recovery. Conversely, the price could decline further if it fails to break the $0.2600 and $0.2630 resistance levels. On the downside, the main support is near the $0.2460 level.
Looking at the chart, ripple price is clearly preparing for the next major break either above $0.2630 or below $0.2460. As long as the bulls are defending the $0.2460 support, there are high chances of an upside break above $0.2600 and $0.2630. Conversely, the price could decline towards $0.2200 if it breaks $0.2460.
Technical indicators
4 hours MACD – The MACD for XRP/USD is struggling to gain pace in the bullish zone.
4 hours RSI (Relative Strength Index) – The RSI for XRP/USD is still well below the 50 level.
Key Support Levels – $0.2500, $0.2460 and $0.2400.
Key Resistance Levels – $0.2600 and $0.2630.


Leave a Reply
You must be logged in to post a comment.