
- Ethereum price is trading in a bearish zone below the $202 resistance area against the US Dollar.
- ETH price is currently at a risk of a downside break below the $182 and $180 supports.
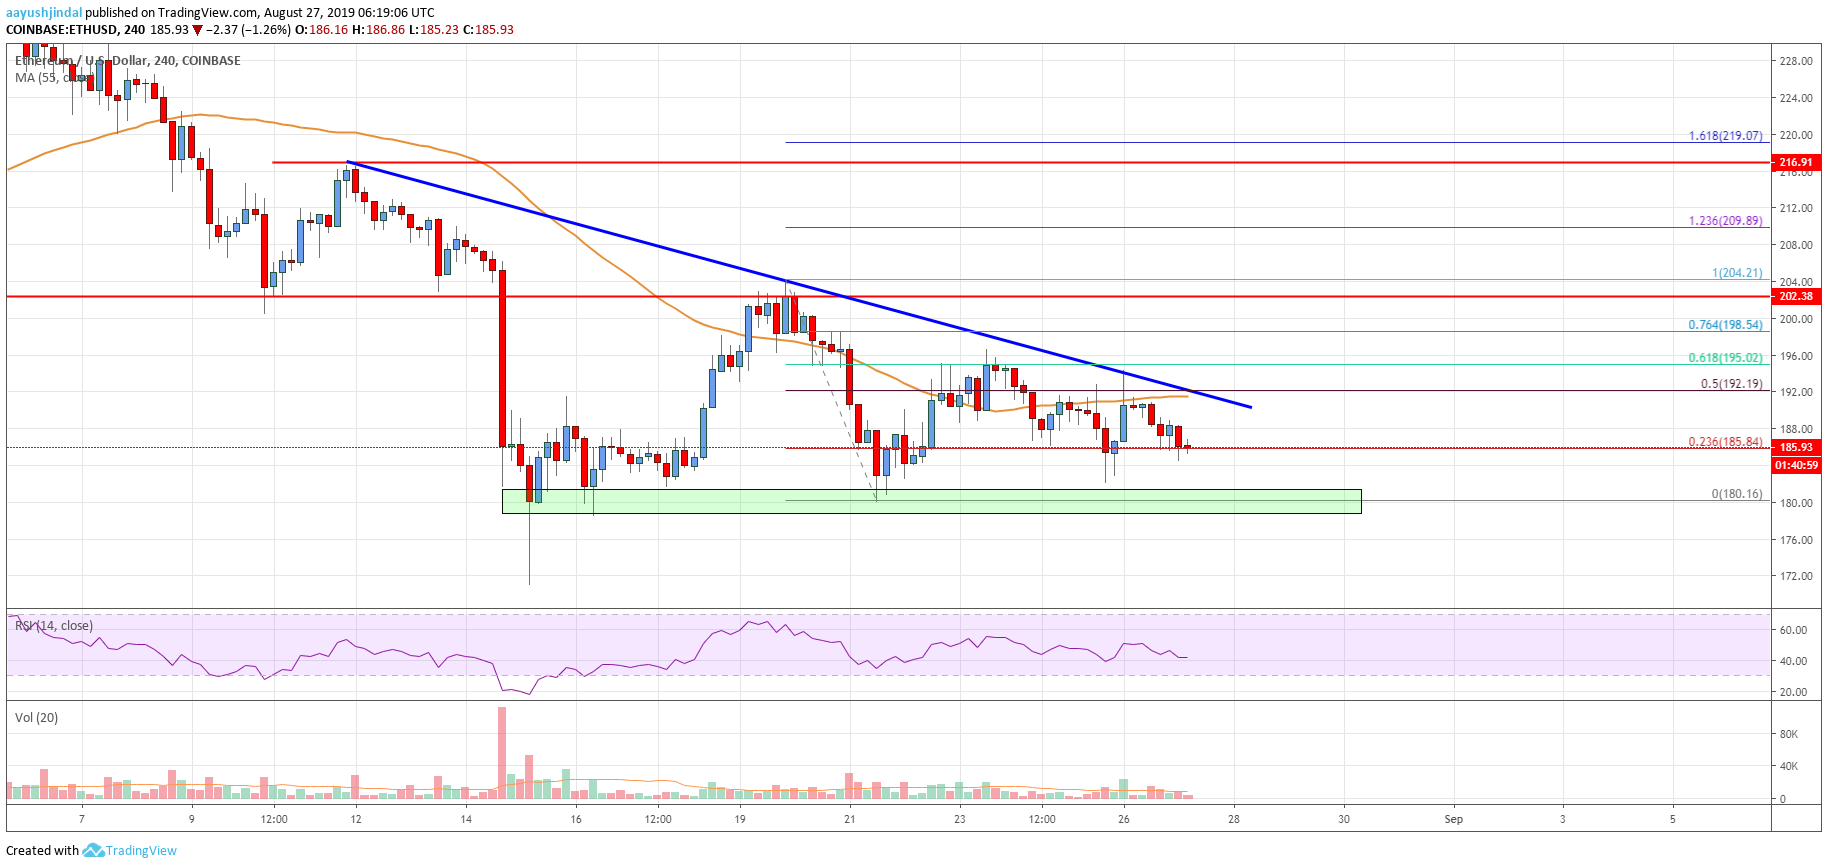
- There is a major bearish trend line forming with resistance near $192 on the 4-hours chart (data feed from Coinbase).
- The price could decline heavily if it continues to struggle near $192 and $195.
Ethereum price is facing many important resistances near $192-195 against the US Dollar. ETH price could either rally above $195 or it might decline below $180.
Ethereum Price Analysis
This past week, Ethereum price started an upside correction from the $180 support against the US Dollar. The ETH/USD pair traded above the $185 and $190 resistance levels. Moreover, there was a break above the $192 level and the 55 simple moving average (4-hours). During the rise, the price climbed above the 50% Fib retracement level of the downward move from the $204 high to $180 low.
Finally, the price spiked above the $195 resistance area, but it struggled to continue higher. It seems like the 61.8% Fib retracement level of the downward move from the $204 high to $180 low acted as a resistance. Moreover, there is a major bearish trend line forming with resistance near $192 on the 4-hours chart. The pair failed to continue higher and recently started a fresh decline below $192.
Additionally, the price is now trading below the $190 level and the 55 simple moving average (4-hours). An immediate support is near the $180 level, which acted as a strong buy zone on a couple of occasions. If there is a downside break below the $180 support, there is a risk of more losses towards the $172 and $170 support levels in the near term.
On the upside, there are many resistances near $192, $194 and $195. Moreover, the 55 simple moving average (4-hours) is close to $192 to act as a resistance. If there is an upside break above the trend line and $195, the price could revisit the key $202 and $204 resistance levels.
Looking at the chart, Ethereum price is trading in a bearish zone below $192 and $195. To start a nice upward move, the price must settle above $195 and the 55 simple moving average (4-hours). If not, it could continue to move down towards the $170 level.
Technical indicators
4 hours MACD – The MACD for ETH/USD is gaining momentum in the bearish zone.
4 hours RSI (Relative Strength Index) – The RSI for ETH/USD is currently declining and it well below 50.
Key Support Levels – $180, followed by the $172 zone.
Key Resistance Levels – $195 and $202.


Leave a Reply
You must be logged in to post a comment.