
- Stellar lumen price is trading in a downtrend below the $0.0650 resistance against the US Dollar.
- XLM price could accelerate decline if it breaks the $0.0600 support area in the near term.
- There is a key bearish trend line forming with resistance near $0.0630 on the 4-hours chart (data feed via Kraken).
- The pair could only recover if it breaks the $0.0630 and $0.0655 resistance levels.
Stellar lumen price is facing many resistances near $0.0650 against the US Dollar. XLM price remains at a risk of a significant decline if it breaks the $0.0600 support area.
Stellar Lumen Price Analysis (XLM to USD)
This past week, stellar lumen price started a major decline from the $0.0720 resistance against the US Dollar. The XLM/USD pair broke many supports on the way down such as $0.0680 and $0.0650. Moreover, there was a close below the $0.0650 pivot level and the 55 simple moving average (4-hours). It opened the doors for more downsides below the $0.0630 level.
The price traded to a new monthly low at $0.0604 and it is currently consolidating losses. An immediate resistance is near the $0.0630 level. Additionally, the 23.6% Fibonacci retracement level of the recent decline from the $0.0720 high to $0.0604 low is also near the $0.0631 level. More importantly, there is a key bearish trend line forming with resistance near $0.0630 on the 4-hours chart.
If there is an upside break above the trend line, the price could test the main $0.0655 resistance area. The 55 simple moving average (4-hours) is also near the $0.0655 level. Moreover, the 50% Fibonacci retracement level of the recent decline from the $0.0720 high to $0.0604 low is waiting near the $0.0662 level to act as a strong resistance in the coming sessions.
If the price fails to climb above the $0.0630 or $0.0655 resistance levels, it could continue to move down. The main support on the downside is near the $0.0600 level. If there is a downside break below the $0.0600 support, the price is likely to accelerate its decline towards the $0.0550 support area.
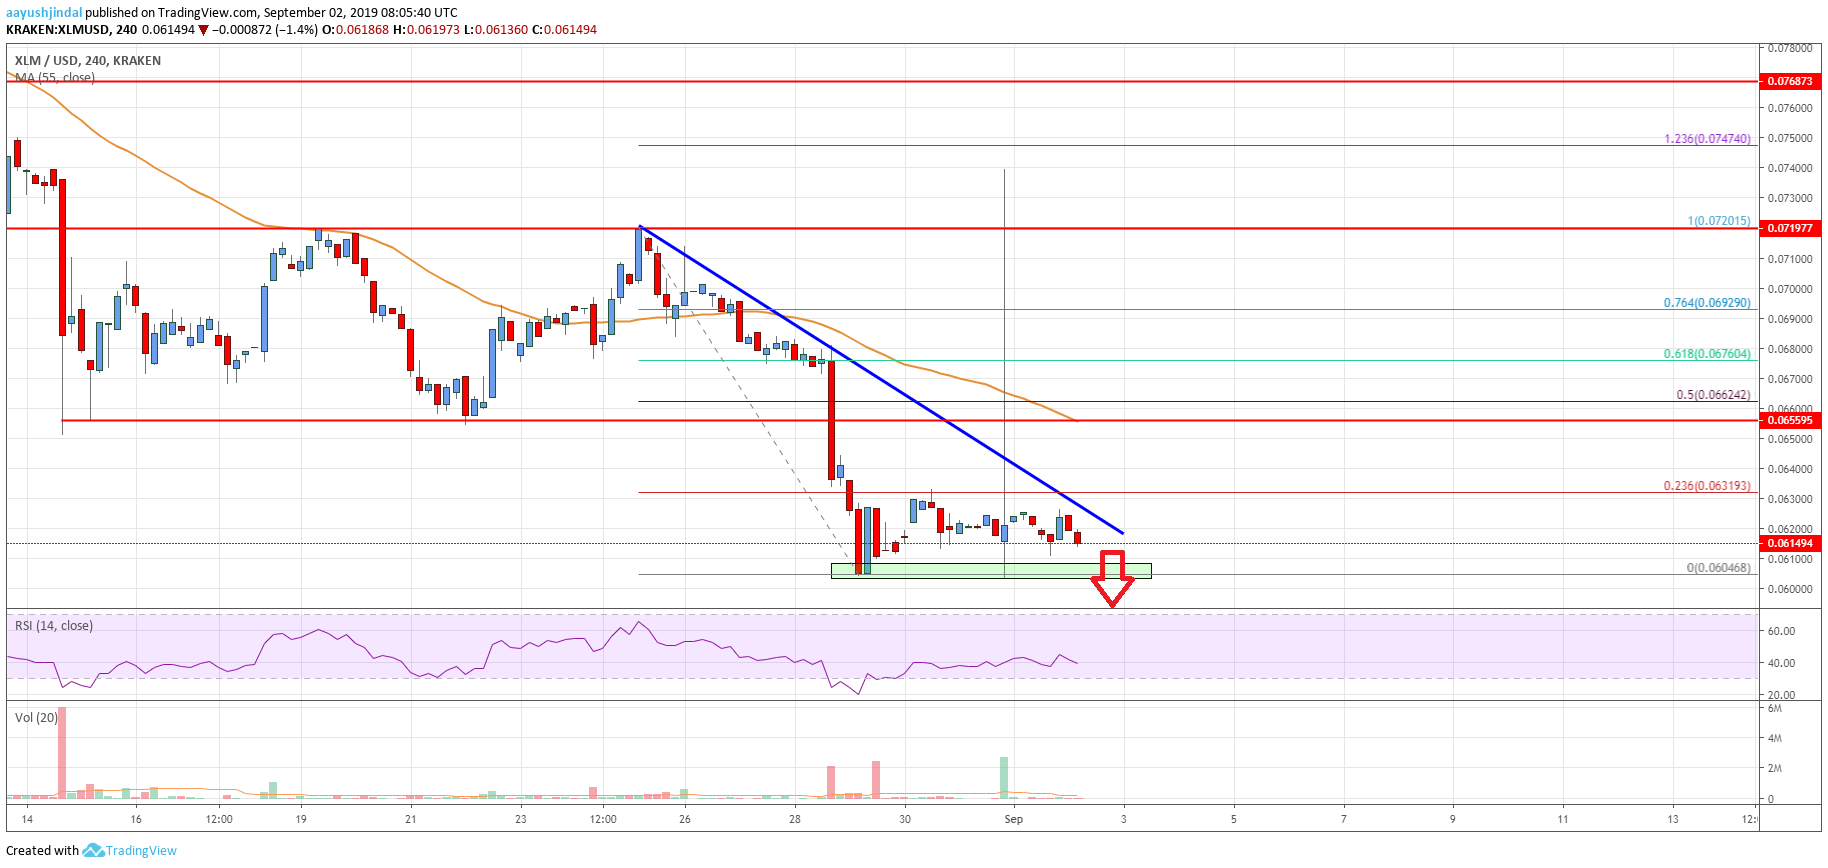
The chart indicates that XLM price is clearly trading in a downtrend and it could decline further if it breaks the $0.0600 support area in the near term. Conversely, the price must settle above $0.0630 and $0.0655 to start a solid recovery in the coming days. The next major resistance above $0.0655 is near the $0.0720 level.
Technical Indicators
4 hours MACD – The MACD for XLM/USD is gaining momentum in the bearish zone.
4 hours RSI – The RSI for XLM/USD is currently just above the 40 level.
Key Support Levels – $0.0600 and $0.0550.
Key Resistance Levels – $0.0630, $0.0655 and $0.0720.


Leave a Reply
You must be logged in to post a comment.