- Stellar lumen price retested the key $0.0650 support and recovered higher against the US Dollar.
- XLM price is currently facing many hurdles on the upside near $0.0720 and $0.0750.
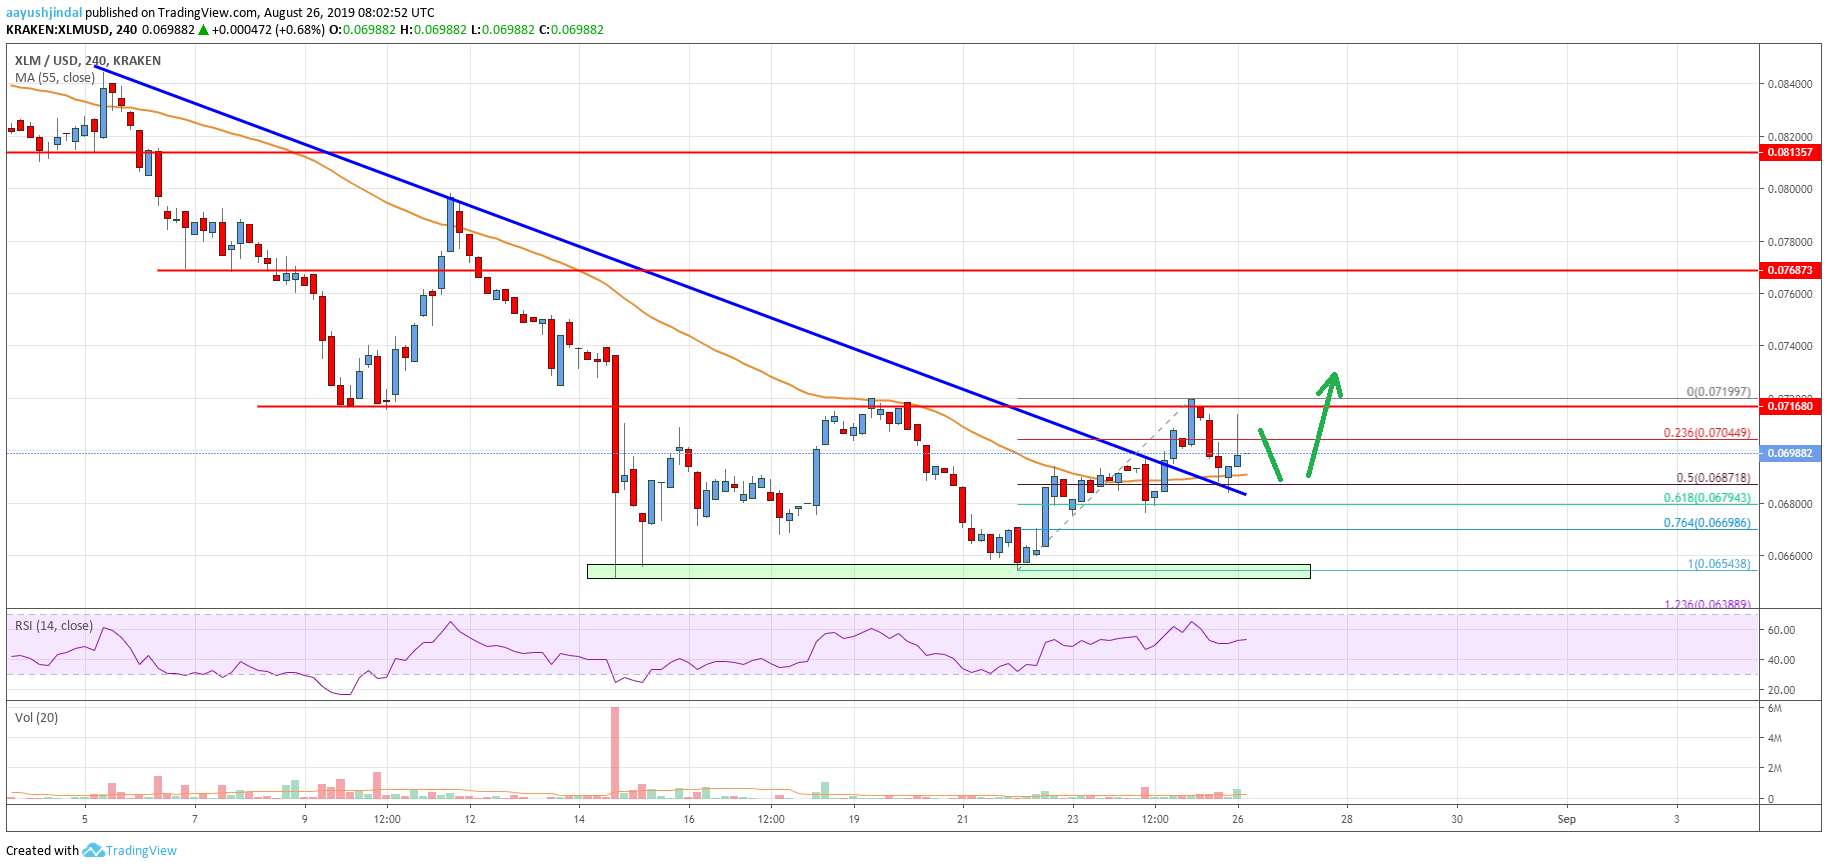
- There was a break above a major bearish trend line with resistance near $0.0695 on the 4-hours chart (data feed via Kraken).
- The pair is currently trading near $0.0700 and seems to be facing a strong resistance near $0.0720.
Stellar lumen price is facing an uphill task near $0.0720 against the US Dollar. XLM price could recover if it breaks $0.0720 and $0.0750 in the near term.
Stellar Lumen Price Analysis (XLM to USD)
This past week, stellar lumen price failed to recover above the $0.0720 resistance against the US Dollar. As a result the XLM/USD pair even started a fresh decrease below the $0.0700 level and 55 simple moving average (4-hours). Moreover, there was a break below the $0.0680 support area. Finally, the price retested the $0.0650 support area. The recent swing low was near $0.0654 before the price started an upside correction.
There was a break above the $0.0680 resistance and the 55 simple moving average (4-hours). Moreover, there was a break above a major bearish trend line with resistance near $0.0695 on the 4-hours chart. However, the price struggled near the key $0.0718 and $0.0720 resistance levels. The price is currently correcting below $0.0705 plus the 23.6% Fibonacci retracement level of the recent wave from the $0.0654 low to $0.0719 high.
However, the $0.0685 level is acting as a support along with the 55 simple moving average (4-hours). Additionally, the 50% Fibonacci retracement level of the recent wave from the $0.0654 low to $0.0719 high is also providing support. If there is a downside break below the $0.0680 level and the 55 simple moving average (4-hours), the price could retest the $0.0650 support.
Any further declines below the $0.0650 support might accelerate losses towards the $0.0600 and $0.0580 levels. On the upside, the main resistance is near the $0.0750 level. If there is a successful close above the $0.0720 resistance, the price could recover towards the $0.0750 and $0.0765 resistance levels.
The chart indicates that XLM price is clearly attempting to climb higher, but it is facing a strong resistance near $0.0720. The next couple of days could be important and the price is likely to make another attempt to climb higher towards $0.0750 and $0.0765. If it fails, it could break the $0.0650 support.
Technical Indicators
4 hours MACD – The MACD for XLM/USD is losing momentum in the bullish zone.
4 hours RSI – The RSI for XLM/USD is currently flat above the 50 level.
Key Support Levels – $0.0680 and $0.0650.
Key Resistance Levels – $0.0720, $0.0750 and $0.0765.