- Stellar lumen price corrected higher after trading to a new monthly low at $0.0716 against the US Dollar.
- XLM price is currently trading below the key $0.0800 and $0.0815 resistance levels.
- There is a major bearish trend line forming with resistance near $0.0790 on the 4-hours chart (data feed via Kraken).
- The pair could resume its decline unless there is an upside break above the $0.0800 and $0.0820 levels.
Stellar lumen price is trading in a bearish zone below $0.0820 against the US Dollar. XLM price might resume its decline towards the $0.0700 support area.
Stellar Lumen Price Analysis (XLM to USD)
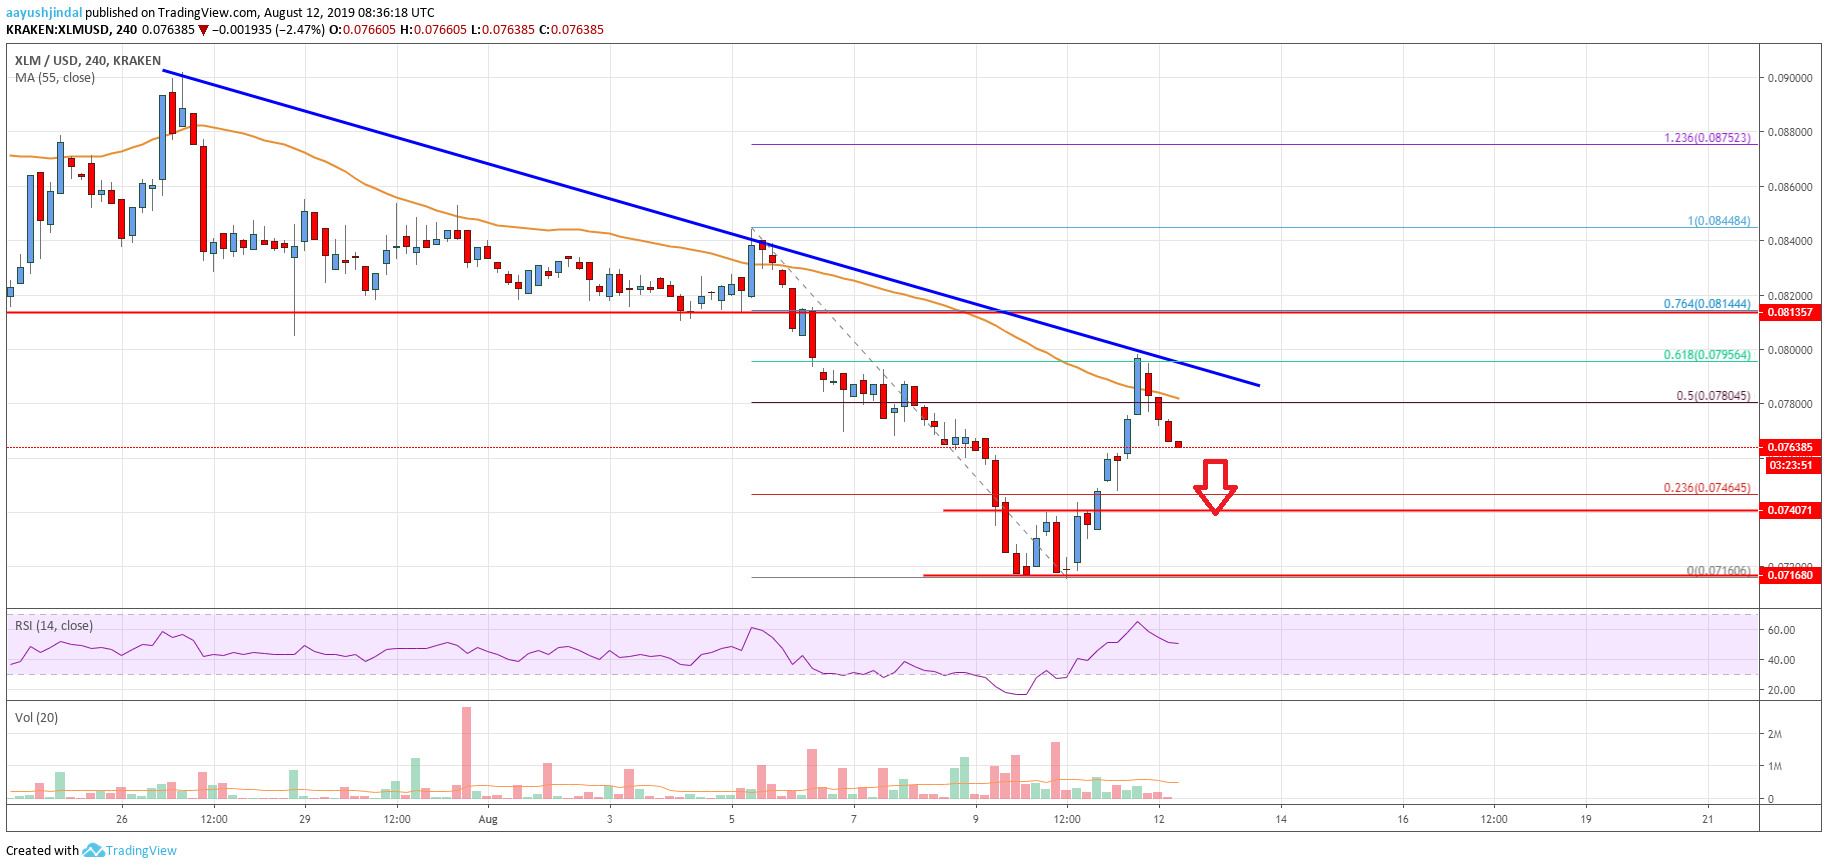
This past week, stellar lumen price declined heavily below the $0.0815 support area against the US Dollar. The XLM/USD pair traded below the $0.0800 support and the 55 simple moving average (4-hours). Moreover, there was a break below the $0.0750 support and the price traded to a new monthly low at $0.0716. Recently, it started an upside correction above the $0.0750 resistance.
There was a break above the $0.0780 resistance plus the 50% Fibonacci retracement level of the downward move from the $0.0844 high to $0.0716 low. However, the upward move was capped by the key $0.0800 resistance area. More importantly, there is a major bearish trend line forming with resistance near $0.0790 on the 4-hours chart. The price also failed to settle above the $0.0795 level and the 55 simple moving average (4-hours).
Additionally, the price topped near the 61.8% Fibonacci retracement level of the downward move from the $0.0844 high to $0.0716 low. At the moment, the price is declining and is trading below the $0.0780 level. If it continues to decline, the $0.0750 level might provide support. However, if the price fails to stay above $0.0750, the bears could eye the $0.0720 and $0.0700 support levels.
Conversely, the price must break the trend line, the 55 SMA, and the $0.0800 resistance to start a decent upward move. More importantly, the price must surpass the $0.0815 and $0.0820 resistances (the previous supports) to move into a bullish zone.
The chart indicates that XLM price is clearly trading below a few important resistances near $0.0800 and $0.0815. Therefore, the price is likely to resume its decline unless there is an upside break above the $0.0800 and $0.0820 levels. The main support on the downside is near $0.0750, below which the price could test the $0.0700 level.
Technical Indicators
4 hours MACD – The MACD for XLM/USD is gaining strength in the bearish zone.
4 hours RSI – The RSI for XLM/USD is currently near the 50 level, with a bearish angle.
Key Support Levels – $0.0750 and $0.0700.
Key Resistance Levels – $0.0800, $0.0815 and $0.0820.