- Stellar lumen failed to climb above $0.0980 and started a fresh decline against the US Dollar.
- XLM price is holding the $0.0800 support, but there is a risk of more losses in the near term.
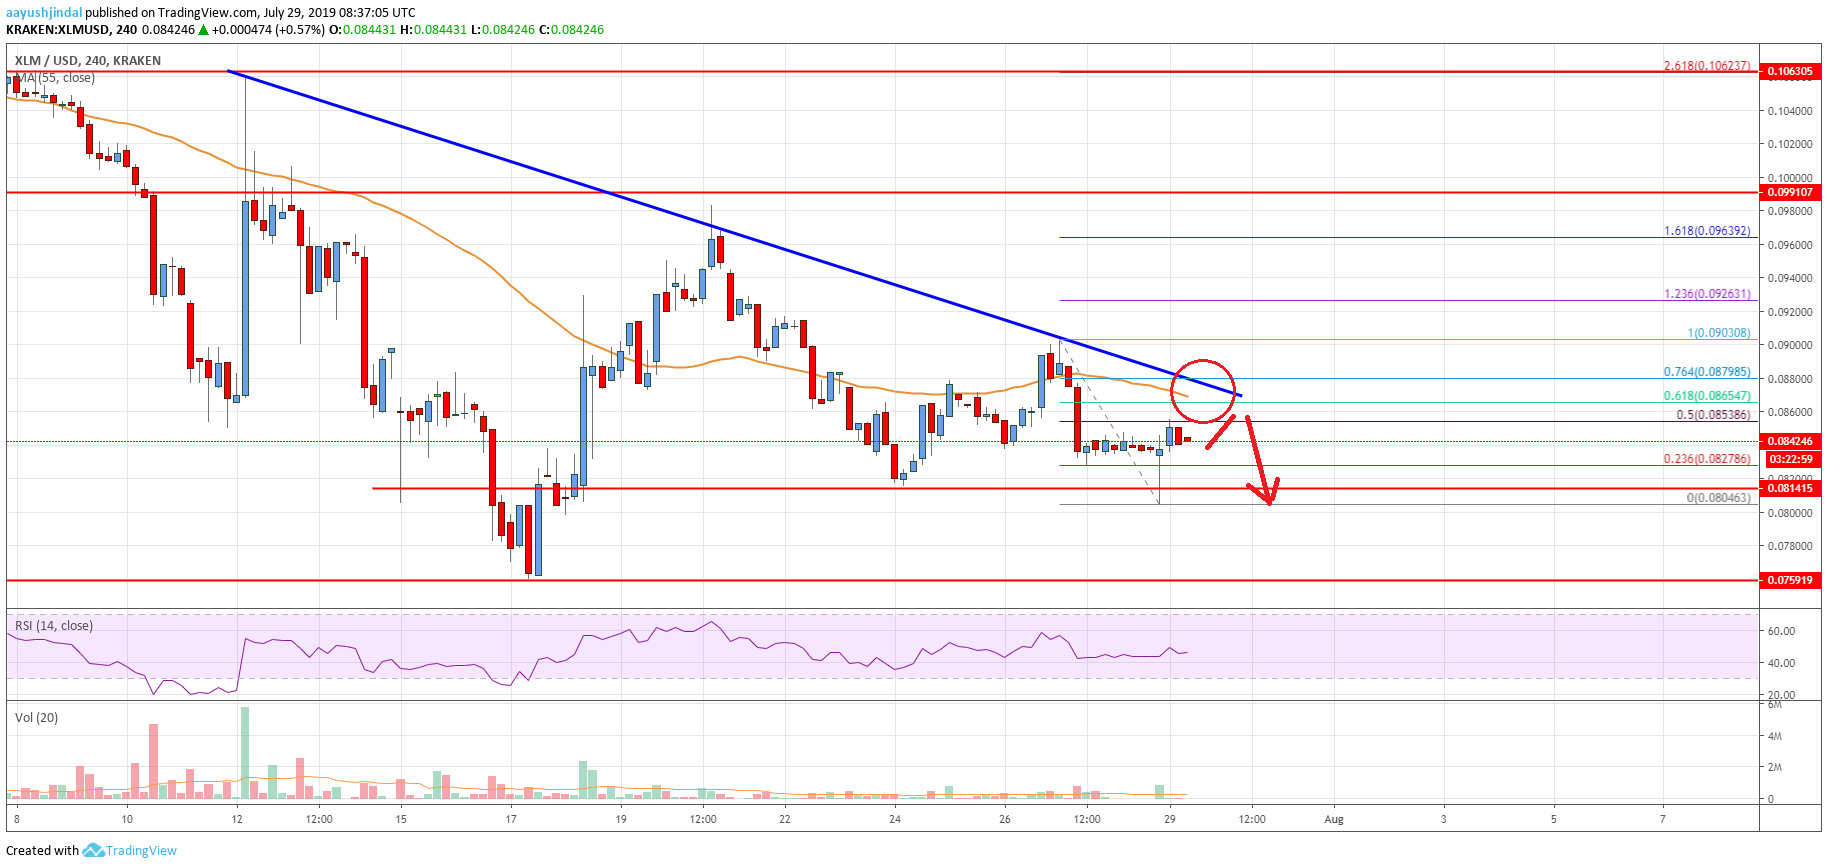
- There is a major bearish trend line forming with resistance near $0.0870 on the 4-hours chart (data feed via Kraken).
- The pair could face a lot of hurdles near the $0.0880 and $0.0900 levels in the near term.
Stellar lumen price is currently trading with a bearish bias against the US Dollar. XLM price might continue to slide unless it settles above $0.0900.
Stellar Lumen Price Analysis (XLM to USD)
This past week, stellar lumen price started a fresh decline from well above $0.0950 against the US Dollar. The XLM/USD pair was rejected near the $0.0980 level, resulting in bearish moves. The pair broke the $0.0920 and $0.0900 levels to enter a bearish zone. Moreover, there was a close below $0.0880 and the 55 simple moving average (4-hours).
A swing low was formed recently near $0.0804 and the price seems to be forming a decent support above $0.0800. It recovered above the $0.0820 level plus the 23.6% Fibonacci retracement level of the downward move from the $0.0903 high to $0.0804 low. However, the $0.0850 level seems to be acting as a resistance and preventing more gains. Moreover, the 50% Fibonacci retracement level of the downward move from the $0.0903 high to $0.0804 low is acting as a resistance.
The next key resistance is near the $0.0865 level and the 55 simple moving average (4-hours). More importantly, there is a major bearish trend line forming with resistance near $0.0870 on the 4-hours chart. If there is an upside break above the trend line and the $0.0880 resistance level, the price could recover further. The next key resistance is near $0.0900, above which the price could revisit the $0.0980 and $0.01000 resistance levels.
Conversely, if there is no upside break above $0.0880 and $0.0900, the price could resume its decline. An initial support is near the $0.0820 level, below which the price might even break the $0.0800 support area.

The chart indicates that XLM price is facing a strong resistance near $0.0880. If the bulls gain pace above $0.0880 and $0.0900, there are high chances of a strong upward move towards the $0.1000 pivot level. If not, the price may soon break the $0.0800 support and test the $0.0750 support.
Technical Indicators
4 hours MACD – The MACD for XLM/USD is slowly losing pace in the bearish zone.
4 hours RSI – The RSI for XLM/USD is currently well below the 50 level, with a flat structure.
Key Support Levels – $0.0820 and $0.0800.
Key Resistance Levels – $0.0970, $0.0980 and $0.1000.


Leave a Reply
You must be logged in to post a comment.