- Stellar lumen price extended its decline below the $0.0750 and $0.0700 supports against the US Dollar.
- XLM price is currently correcting higher, but it is facing many resistances near $0.0725.
- There is a crucial bearish trend line forming with resistance near $0.0740 on the 4-hours chart (data feed via Kraken).
- The pair could either continue to recover above $0.0750 or it might resume its decline to $0.0600.
Stellar lumen price is trading below many key resistances near $0.0750 against the US Dollar. XLM price needs to gain strength above $0.0725 and $0.0750 to continue higher.
Stellar Lumen Price Analysis (XLM to USD)
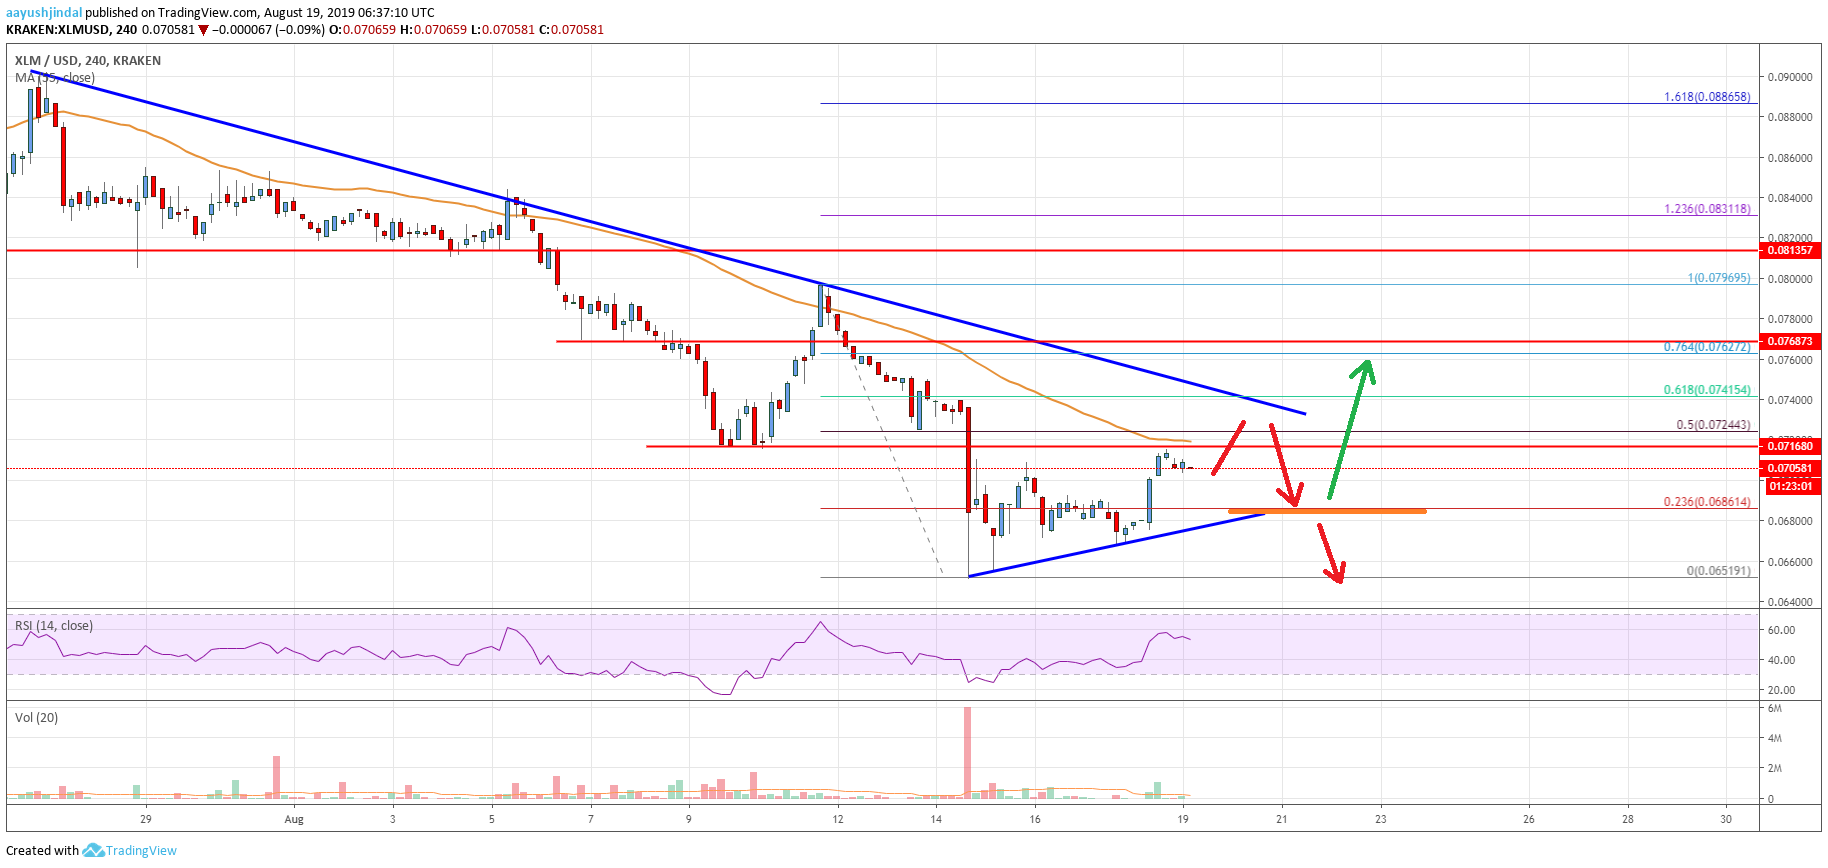
This past week, stellar lumen price declined heavily below the $0.0800 support area against the US Dollar. The XLM/USD pair even traded below the $0.0750 and $0.0725 support levels. Moreover, there was a close below $0.0725 and the 55 simple moving average (4-hours). Finally, the price broke the $0.0700 support level and traded to a new monthly low at $0.0651.
Recently, it started an upside correction above the $0.0680 resistance. There was a break above the 23.6% Fibonacci retracement level of the last major drop from the $0.0796 high to $0.0651 low. Additionally, the price climbed above the $0.0700 resistance. However, the bulls are currently facing a strong resistance near the $0.0720 level and the 55 simple moving average (4-hours).
Besides, the 50% Fibonacci retracement level of the last major drop from the $0.0796 high to $0.0651 low is also aligned near the $0.0724 level. More importantly, there is a crucial bearish trend line forming with resistance near $0.0740 on the 4-hours chart. Therefore, the price is likely to face a strong resistance near the $0.0725 and $0.0740 levels.
A successful close above the $0.0750 resistance is needed for upside continuation. The next key resistance is near the $0.0768 level, above which the price might surge towards the $0.0815 level. Conversely, the price could start a fresh decrease from $0.0725. An immediate support is near the $0.0680 level and a connecting bullish trend line on the same chart.

The chart indicates that XLM price is clearly forming a breakout pattern with resistance near $0.0740 and support near $0.0680. As long as the price is below the $0.0725 level and the 55 SMA, there is a risk of a downside break in the coming sessions. On the other hand, a convincing close above $0.0725 and $0.0740 might pump the price above $0.0750 and $0.0768.
Technical Indicators
4 hours MACD – The MACD for XLM/USD is showing positive signs in the bullish zone.
4 hours RSI – The RSI for XLM/USD is currently moving lower towards the 50 level.
Key Support Levels – $0.0680 and $0.0650.
Key Resistance Levels – $0.0725, $0.0740 and $0.0750.


Leave a Reply
You must be logged in to post a comment.