- EOS started a strong decline from well above the $2.800 support zone against the US Dollar.
- The price is currently correcting higher from $2.000, but it is well below the 55 simple moving average (4-hours).
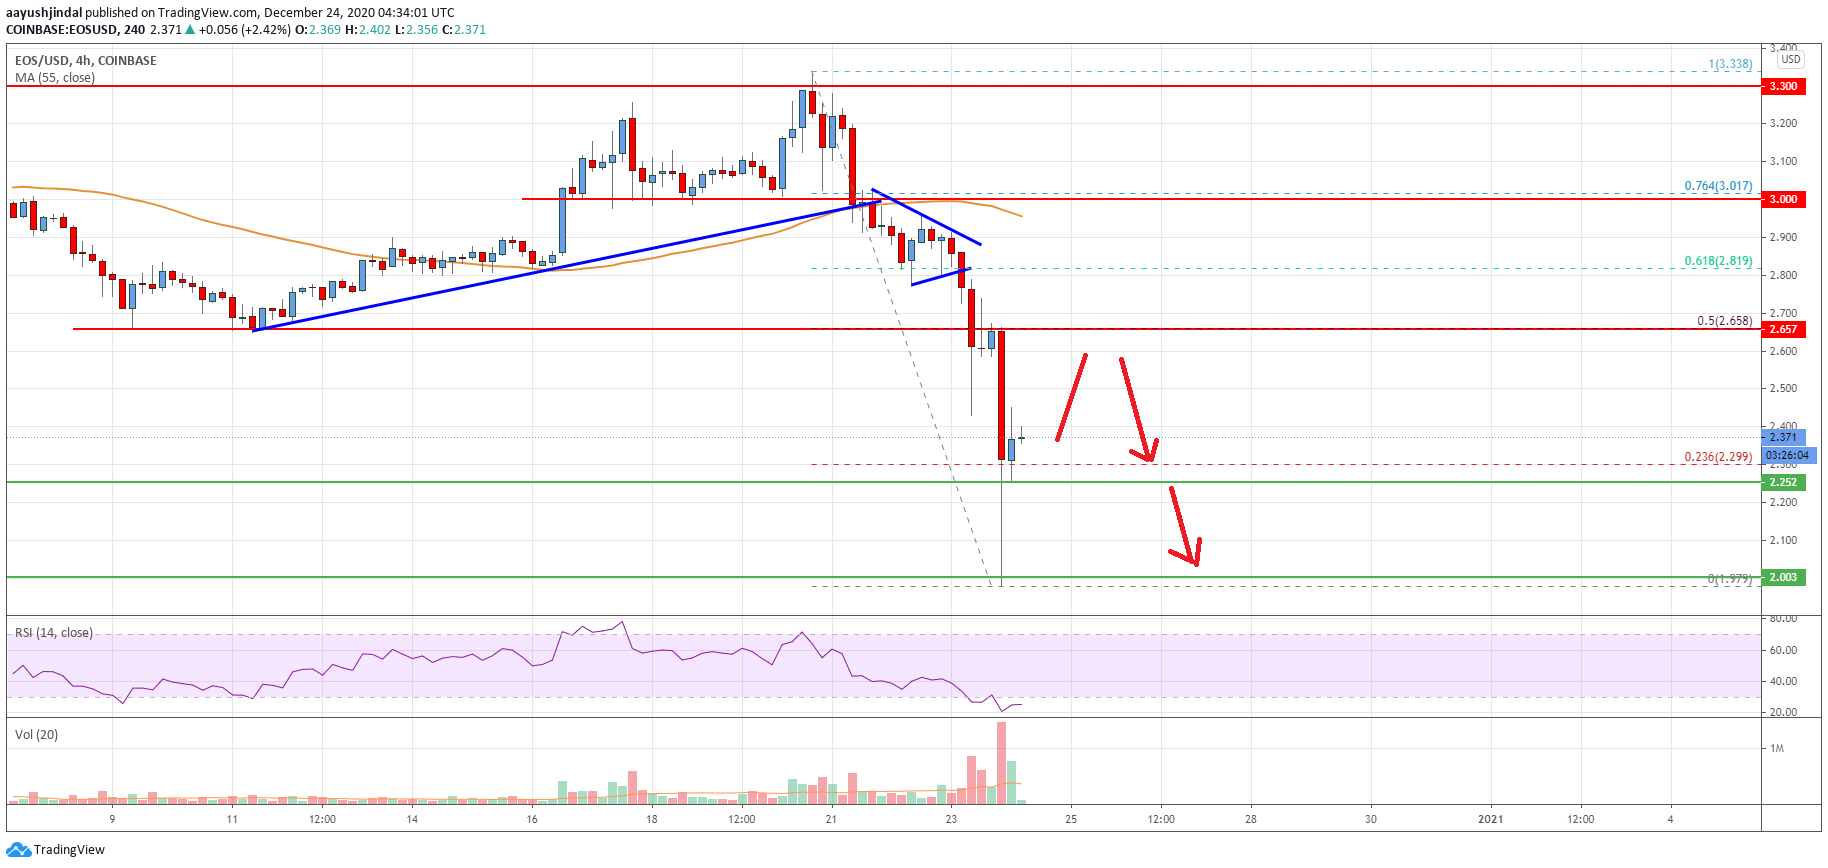
- There was a break below a major bullish trend line with support at $3.000 on the 4-hours chart of the EOS/USD pair (data feed from Coinbase).
- The pair could continue to move lower as long as it is below the $2.650 resistance level.
EOS price started a fresh decline below $2.800 and $2.650 against the US Dollar, similar to bitcoin. The price could resume its decline unless there is a clear break above $2.650.
EOS Price Analysis
After struggling to clear the $3.000 resistance level, EOS price started a fresh decline against the US Dollar. There was a sharp decline below the $2.800 support level and the 55 simple moving average (4-hours) to start the current decline.
The bears were able to push the price below the $2.650 and $2.500 support levels. During the decline, there was a break below a major bullish trend line with support at $3.000 on the 4-hours chart of the EOS/USD pair. The price even spiked below $2.200 and tested the $2.000 support level.
A low is formed near $1.979 and the price is currently correcting higher. It recovered above the $2.300 resistance level. There was a break above the 23.6% Fib retracement level of the recent decline from the $3.338 high to $1.979 low.
The price is now trading above the $2.320 level. An initial resistance on the upside is near the $2.500 level. The first major resistance is near the $2.650 level (the recent breakdown zone).
The 50% Fib retracement level of the recent decline from the $3.338 high to $1.979 low is also near the $2.650 level to act as a barrier. A close above the $2.650 level is needed to start a fresh increase in the near term. Conversely, there is a risk of a fresh decline below the $2.250 level.
An initial support is near the $2.200 level. A clear break below the $2.200 support level might lead the price back towards the $2.000 support level.
Looking at the chart, EOS price is clearly currently correcting higher from $2.000, but it is well below the 55 simple moving average (4-hours). Overall, the price could resume lower as long as it is below the $2.650 resistance level.
Technical indicators
4-hours MACD – The MACD for EOS/USD is slowly losing momentum in the bearish zone.
4-hours RSI (Relative Strength Index) – The RSI is currently correcting higher from the 25 level.
Major Support Levels – $2.200 and $2.000.
Major Resistance Levels – $2.500 and $2.650.
