- Ethereum price gained pace above $700 and traded to a new 2020 high at $748 against the US Dollar.
- ETH price is currently correcting lower below the $720 support, but it is above the 55 simple moving average (4-hours).
- There is a key bullish trend line forming with support near $680 on the 4-hours chart (data feed from Coinbase).
- The pair is likely to find a strong buying interest near the $680 and $670 support levels.
Ethereum price is slowly losing bullish momentum below $720 against the US Dollar. ETH/USD is likely to continue lower, but it could find support near $680 in the coming sessions.
Ethereum Price Analysis
In the past few days, Ethereum gained bullish momentum above the $680 and $700 resistance levels against the US Dollar. ETH price even surged above the $720 level and settled well above the 55 simple moving average (4-hours).
The price traded above the $730 zone and formed a new 2020 high near $748. Recently, it started a downside correction below the $730 and $720 levels. The price is now approaching the $700 support level. It is close to the 23.6% Fib retracement level of the upward move from the $551 swing low to $747 high.
On the downside, there are many important supports forming near the $680 zone. There is also a key bullish trend line forming with support near $680 on the 4-hours chart.
If there is a downside break below the trend line support, the price could continue to move down towards the $650 level. It is close to the 50% Fib retracement level of the upward move from the $551 swing low to $747 high.
Any more losses could lead the price towards the $620 support zone. Conversely, the price could start a fresh increase from $700 or $680. The first major resistance on the upside is near the $720 level. The main resistance I near $740, above which the price test $760 or $775.
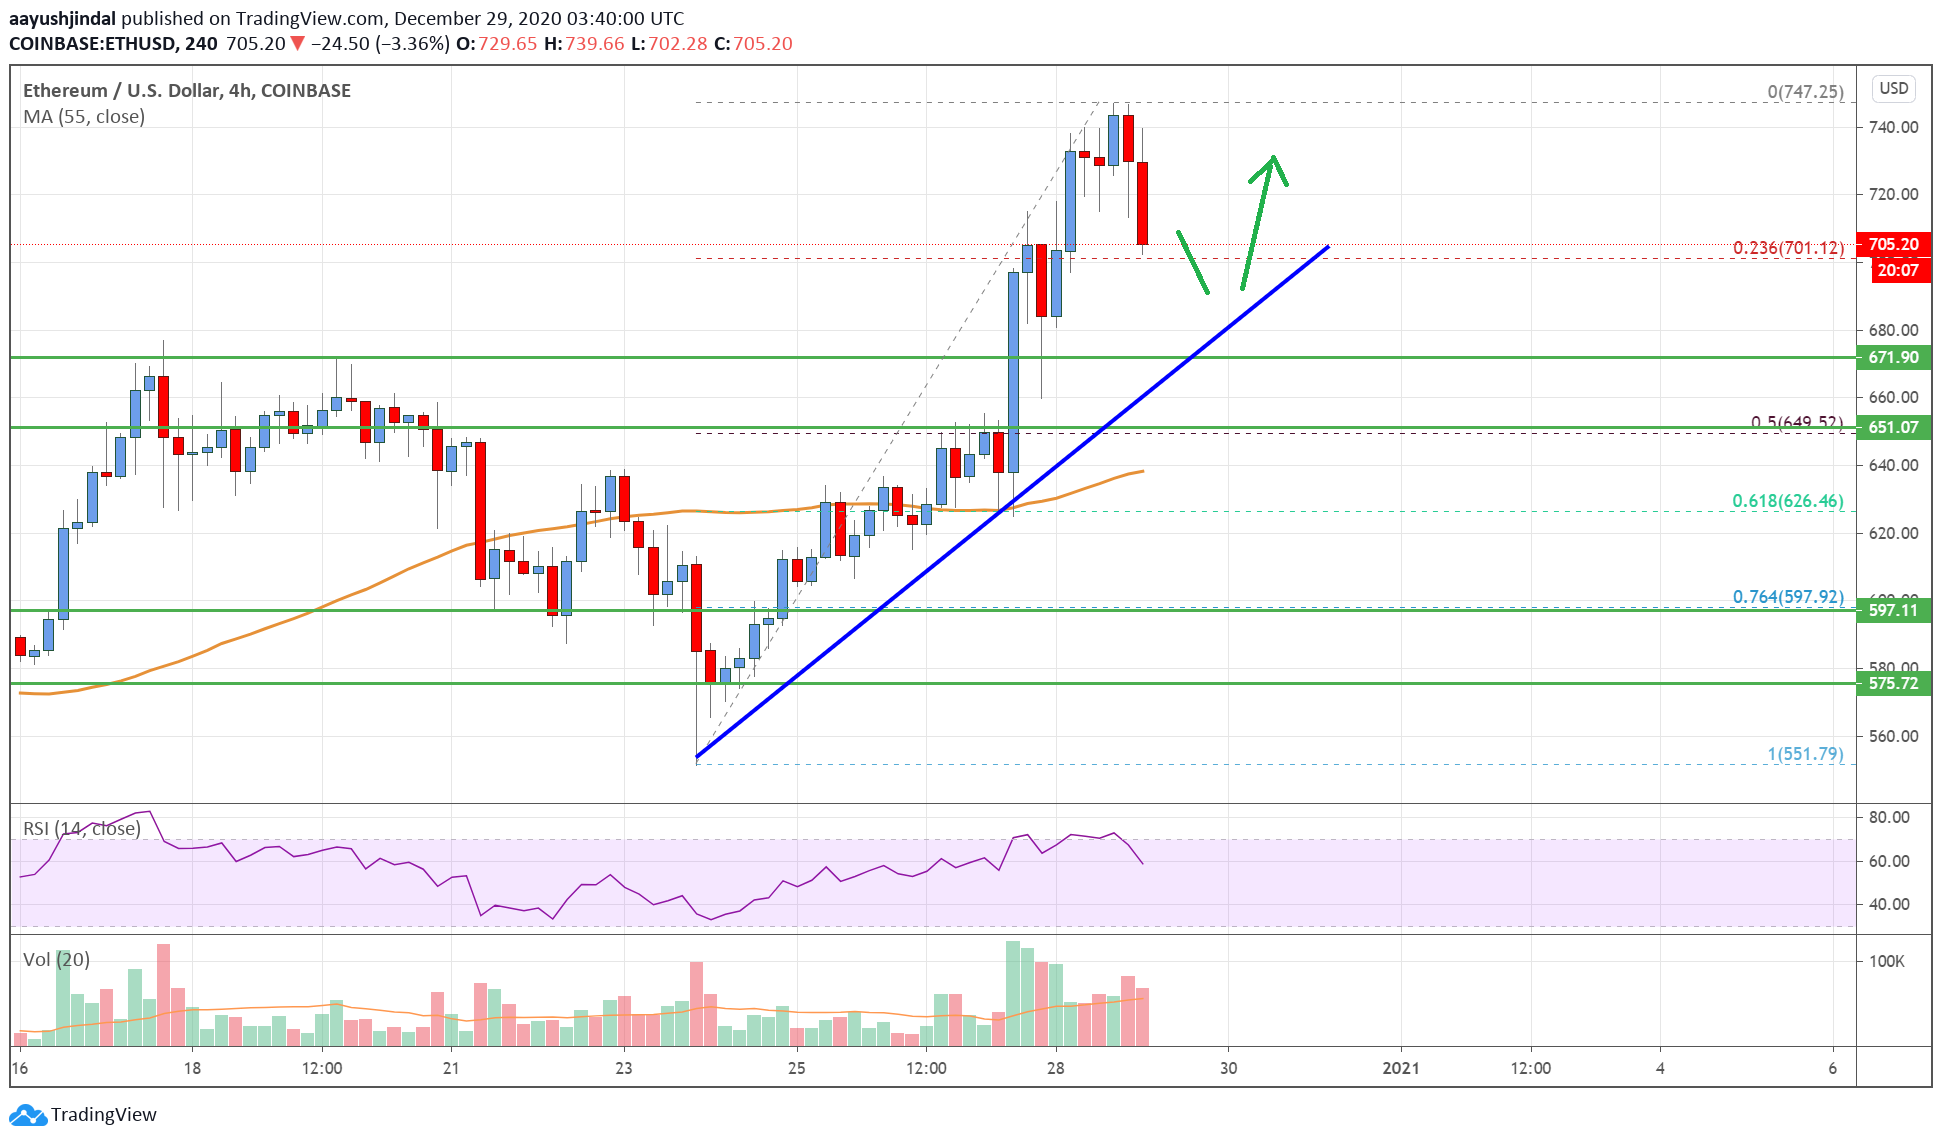
Looking at the chart, Ethereum price is clearly correcting gains from the $748 high, but it is above the 55 simple moving average (4-hours). Overall, ether price is likely to find a strong buying interest near the $680 and $670 support levels.
Technical indicators
4 hours MACD – The MACD for ETH/USD is losing momentum in the bullish zone.
4 hours RSI (Relative Strength Index) – The RSI for ETH/USD is now declining towards the 50 level.
Key Support Levels – $680, followed by the $650 zone.
Key Resistance Levels – $720 and $740.


Leave a Reply
You must be logged in to post a comment.