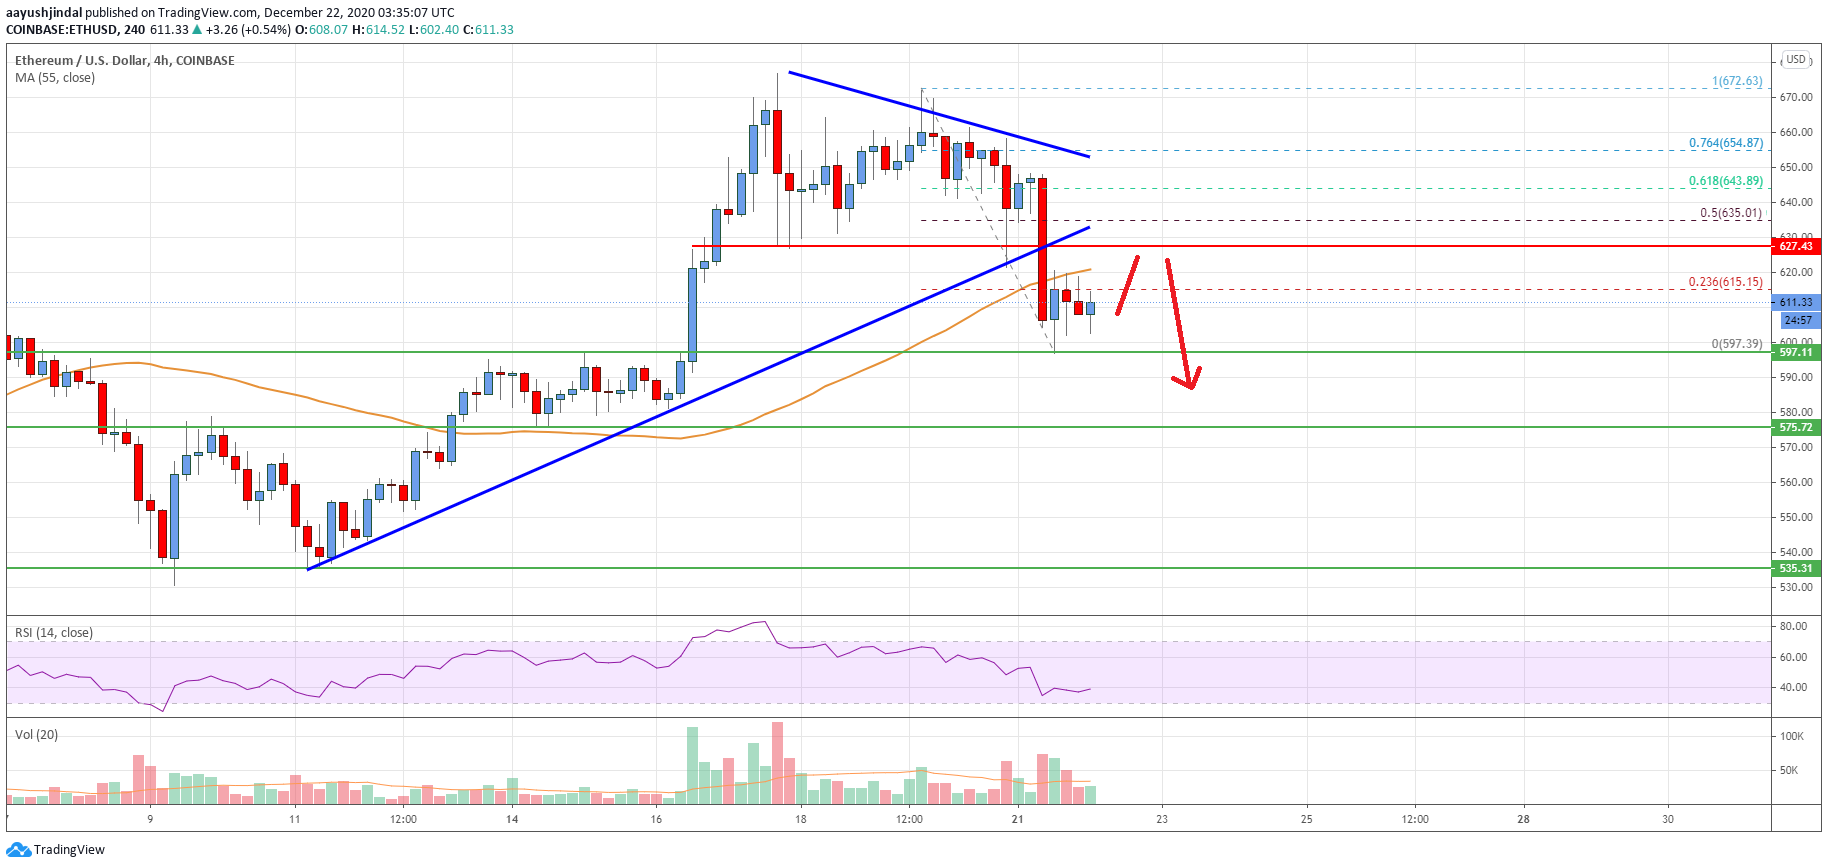
- Ethereum price started a fresh decline from the $670 resistance zone against the US Dollar.
- ETH price is currently trading below the $628 support and the 55 simple moving average (4-hours).
- There was a break below a major contracting triangle with support near $627 on the 4-hours chart (data feed from Coinbase).
- The pair is consolidating losses above $600, but there are chances of more downsides in the near term.
Ethereum price is slowly gaining bearish momentum below $628 against the US Dollar. ETH/USD is likely to continue lower below $600 in the coming sessions.
Ethereum Price Analysis
After a couple of spikes above the $660 and $670 resistance levels, Ethereum price started a fresh decline against the US Dollar. ETH price broke the $650 support level to move into a short-term bearish zone.
The decline gained pace below the $640 level. More importantly, there was a break below a major contracting triangle with support near $627 on the 4-hours chart. The price even settled below the $620 level and the 55 simple moving average (4-hours).
It tested the $600 support zone and traded as low as $597. The price currently consolidating losses above the $600 support, but it is below the 55 simple moving average (4-hours).
An initial resistance is near the $620 level. The 23.6% Fib retracement level of the recent decline from the $672 swing high to $597 low is also acting as a resistance. The first major resistance on the upside is near the $628 level (the recent breakdown zone).
The next resistance sits near the $635 level. It is close to the 50% Fib retracement level of the recent decline from the $672 swing high to $597 low. A clear break above the $628 and $635 resistance levels could start a fresh increase in the coming sessions.
Conversely, the price could continue to move down if it fails near $628. An initial support is near the $600 level. The next main support is near the $575 level, where the bulls are likely to take a strong stand.

Looking at the chart, Ethereum price is clearly showing bearish signs below $628 and the 55 simple moving average (4-hours). Overall, ether price is consolidating losses above $600, but there are chances of more downsides in the near term.
Technical indicators
4 hours MACD – The MACD for ETH/USD is gaining momentum in the bearish zone.
4 hours RSI (Relative Strength Index) – The RSI for ETH/USD is now well below the 50 level.
Key Support Levels – $600, followed by the $575 zone.
Key Resistance Levels – $628 and $635.


Leave a Reply
You must be logged in to post a comment.