- Ethereum price started a downside correction after it failed above $215 against the US Dollar.
- ETH price is currently trading nicely above the $195 and $200 support levels.
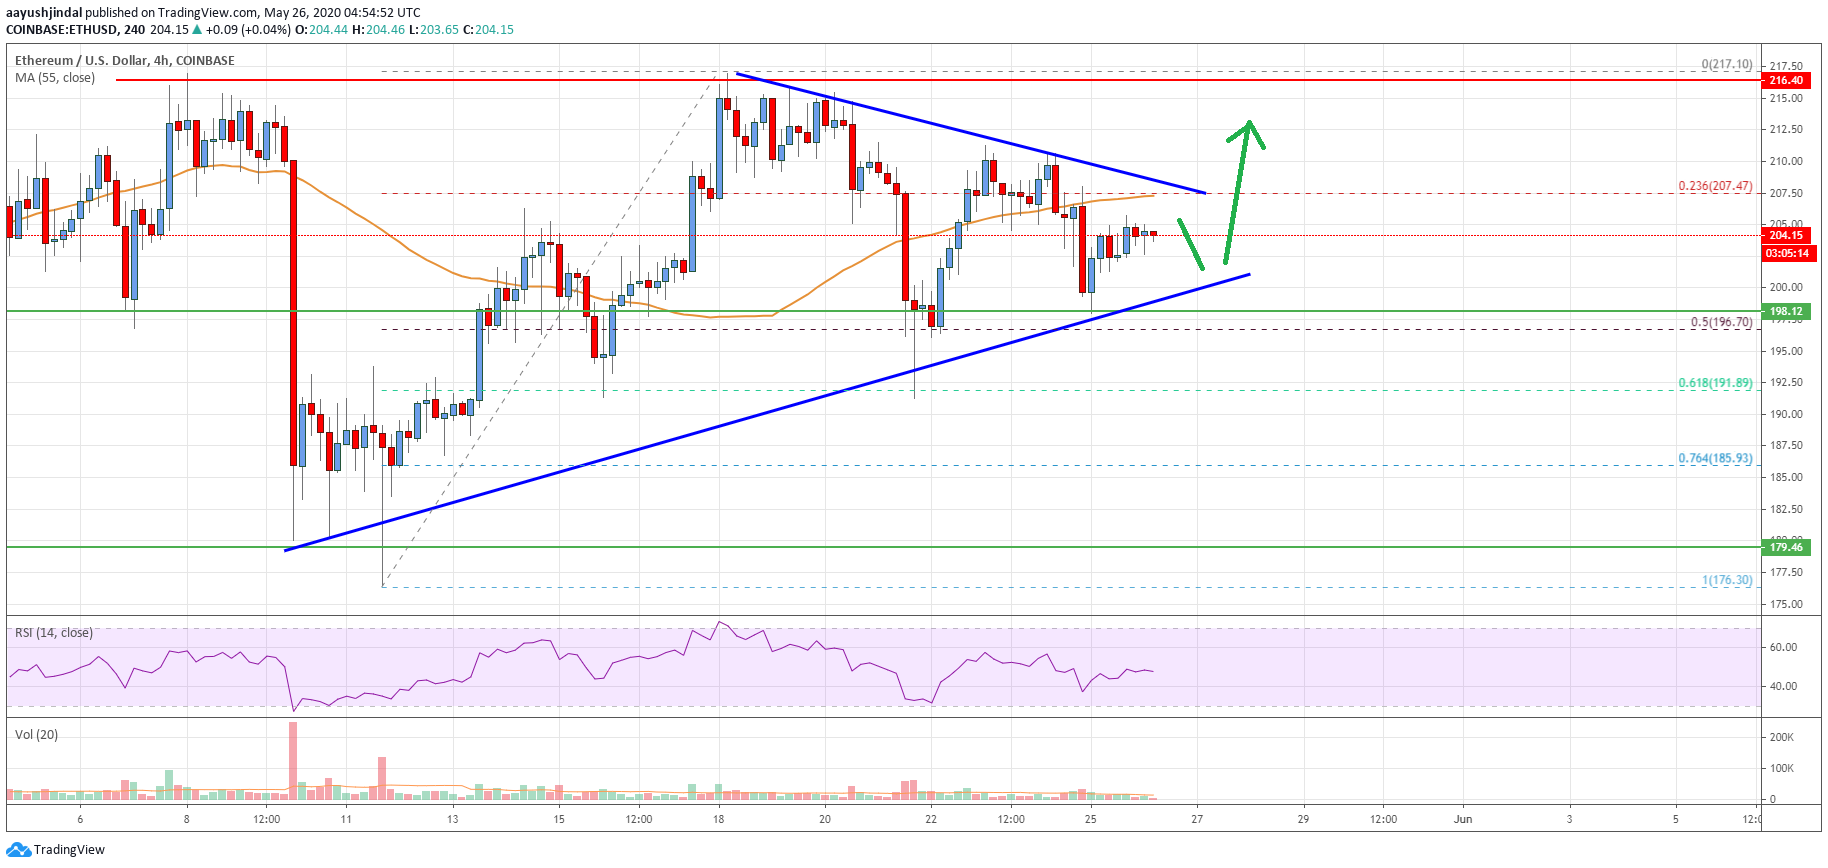
- There is a major contracting triangle forming with resistance near $207 on the 4-hours chart (data feed from Coinbase).
- The pair is likely to rally again above $210 as long as it is trading above the $195 support zone.
Ethereum price is showing a lot of positive signs above $195 against the US Dollar. ETH/USD must surpass the $210 resistance zone to resume its rise in the near term.
Ethereum Price Analysis
After a failed attempt to settle above $215, Ethereum price started a fresh corrective wave against the US Dollar. ETH price traded below the $210 and $208 support levels.
Besides, there was a close below the $210 level and the 55 simple moving average (4-hours). There was also a break below the 23.6% Fib retracement level of the upward move from the $176 swing low to $217 high.
The decline was such that the price even spiked below the $200 support. However, the $195-$196 acted as a strong buy zone. The 50% Fib retracement level of the upward move from the $176 swing low to $217 high is also acting as a decent support.
It seems like there is a major contracting triangle forming with resistance near $207 on the 4-hours chart. On the upside, the triangle resistance is close to the $208 pivot level and the 55 simple moving average (4-hours).
If there is a successful close above the triangle resistance, the 55 simple moving average (4-hours), and $210, the price is likely to accelerate higher in the near term. In the mentioned case, there are high chances of more gains above the $218 and $220 resistance levels.
Conversely, there is a risk of a downside break below the $200 and $198 support levels. The main support is near the $195 level. If there is a proper close below the $195 level, there is a risk of bearish continuation towards the $180 support level.

Looking at the chart, Ethereum price is trading above a few key supports near the $200 zone. Therefore, the price might clear the $210 barrier and continue higher unless it breaks the $195 support.
Technical indicators
4 hours MACD – The MACD for ETH/USD is currently losing pace in the bullish zone.
4 hours RSI (Relative Strength Index) – The RSI for ETH/USD is struggling to settle above the 50 level.
Key Support Levels – $200, followed by the $195 zone.
Key Resistance Levels – $208 and $210.


Leave a Reply
You must be logged in to post a comment.