- Ethereum price is gaining traction above the $120 and $125 resistance levels against the US Dollar.
- ETH price is likely to grind higher towards the $155 and $160 resistance levels.
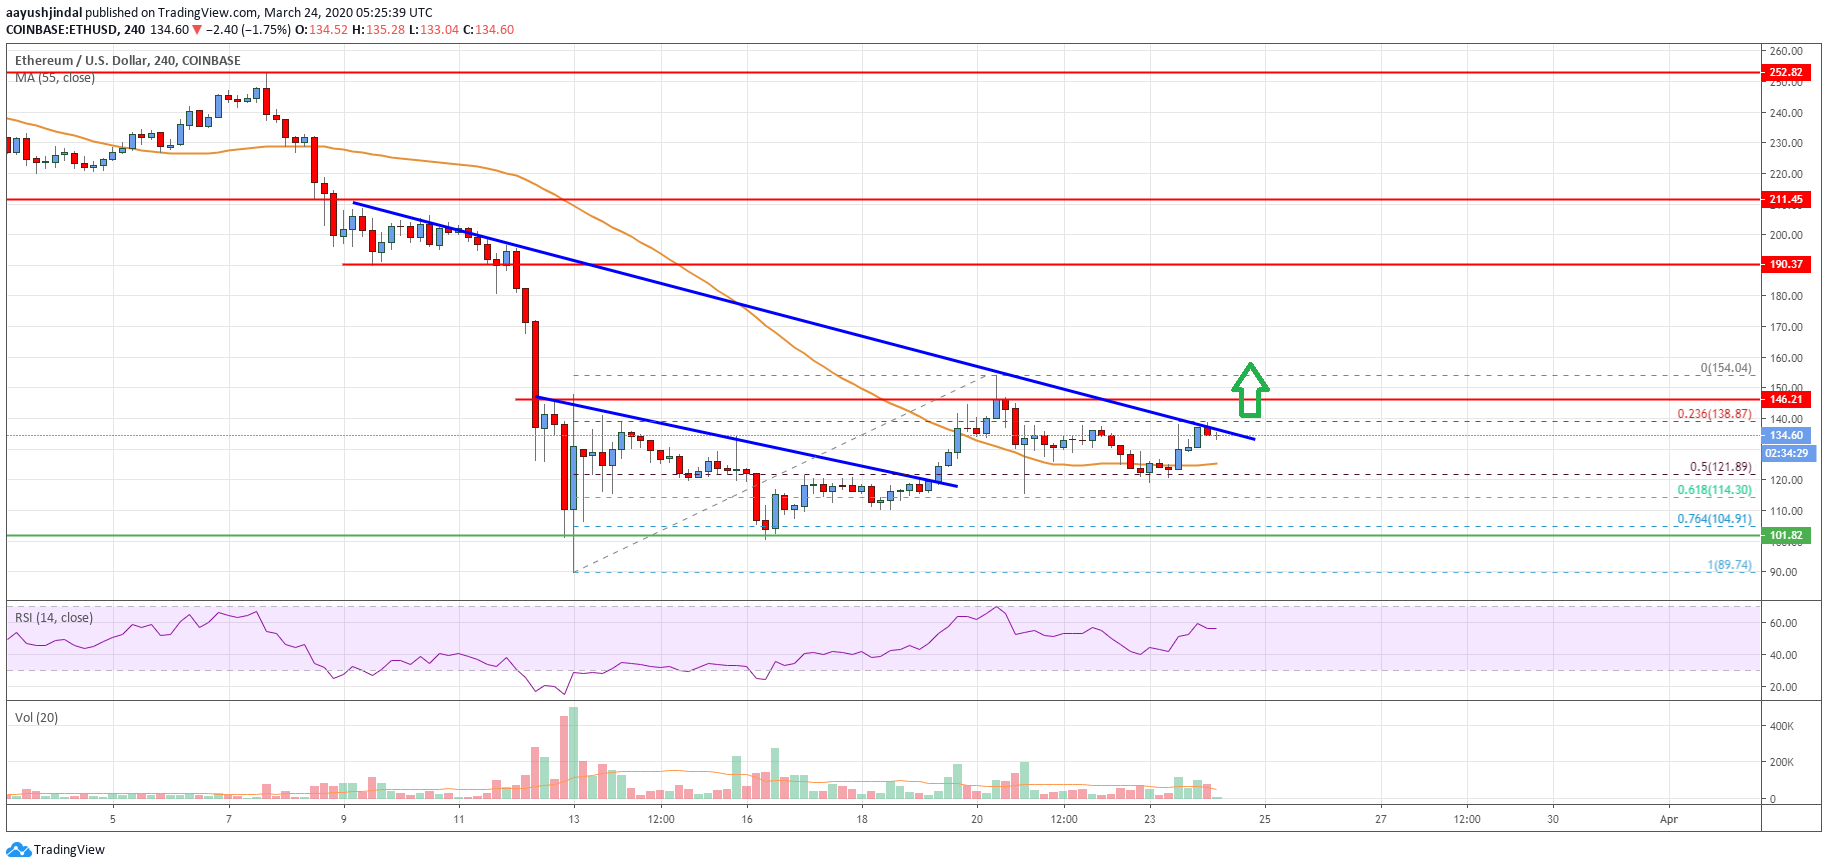
- There is a major bearish trend line forming with resistance near $137 on the 4-hours chart (data feed from Coinbase).
- The price could correct lower, but dips remain well supported near the $122 and $120 levels.
Ethereum price is showing positive signs above $135 against the US Dollar. ETH/USD must surpass $137 and $140 for a strong bullish wave in the coming sessions.
Ethereum Price Analysis
In the past few days, there was a decent recovery wave in Ethereum price above the $110 level against the US Dollar. ETH price gained traction and settled above the $120 level.
Besides, there was a close above the $125 level and the 55 simple moving average (4-hours). The upward move gathered pace above the $130 and $140 levels. Finally, the price traded to a new swing high at $154.
Recently, there was a downside correction below the 23.6% Fib retracement level of the upward move from the $89 low to $154 high. However, the price remained well supported near the $120 zone and the 55 simple moving average (4-hours).
Besides, the 50% Fib retracement level of the upward move from the $89 low to $154 high is acting as a decent support. At the moment, the price is rising and trading above the $130 level.
However, it is facing a major hurdle near the $137 and $138 levels. There is also a major bearish trend line forming with resistance near $137 on the 4-hours chart.
If there is an upside break above the $137 and $140 levels, the bulls are likely to take over. The next resistance on the upside is near the $150 and $155 levels. Any further gains could lead the price towards the $170 level in the near term.
If there is a downside correction, the price may perhaps find bids near the $122 level and the 55 SMA. Any more losses might lead the price towards $110.

Looking at the chart, Ethereum price is showing a few positive signs above the $122 and $125 levels. A clear break above the $140 level is needed for upside acceleration in the near term.
Technical indicators
4 hours MACD – The MACD for ETH/USD is currently losing momentum in the bullish zone.
4 hours RSI (Relative Strength Index) – The RSI for ETH/USD is now above the 50 level.
Key Support Levels – $125, followed by the $120 zone.
Key Resistance Levels – $137 and $140.


Leave a Reply
You must be logged in to post a comment.