
- Ethereum price declined heavily below the key $220 support area against the US Dollar.
- ETH price tested the $190 area and it is currently consolidating losses below $205.
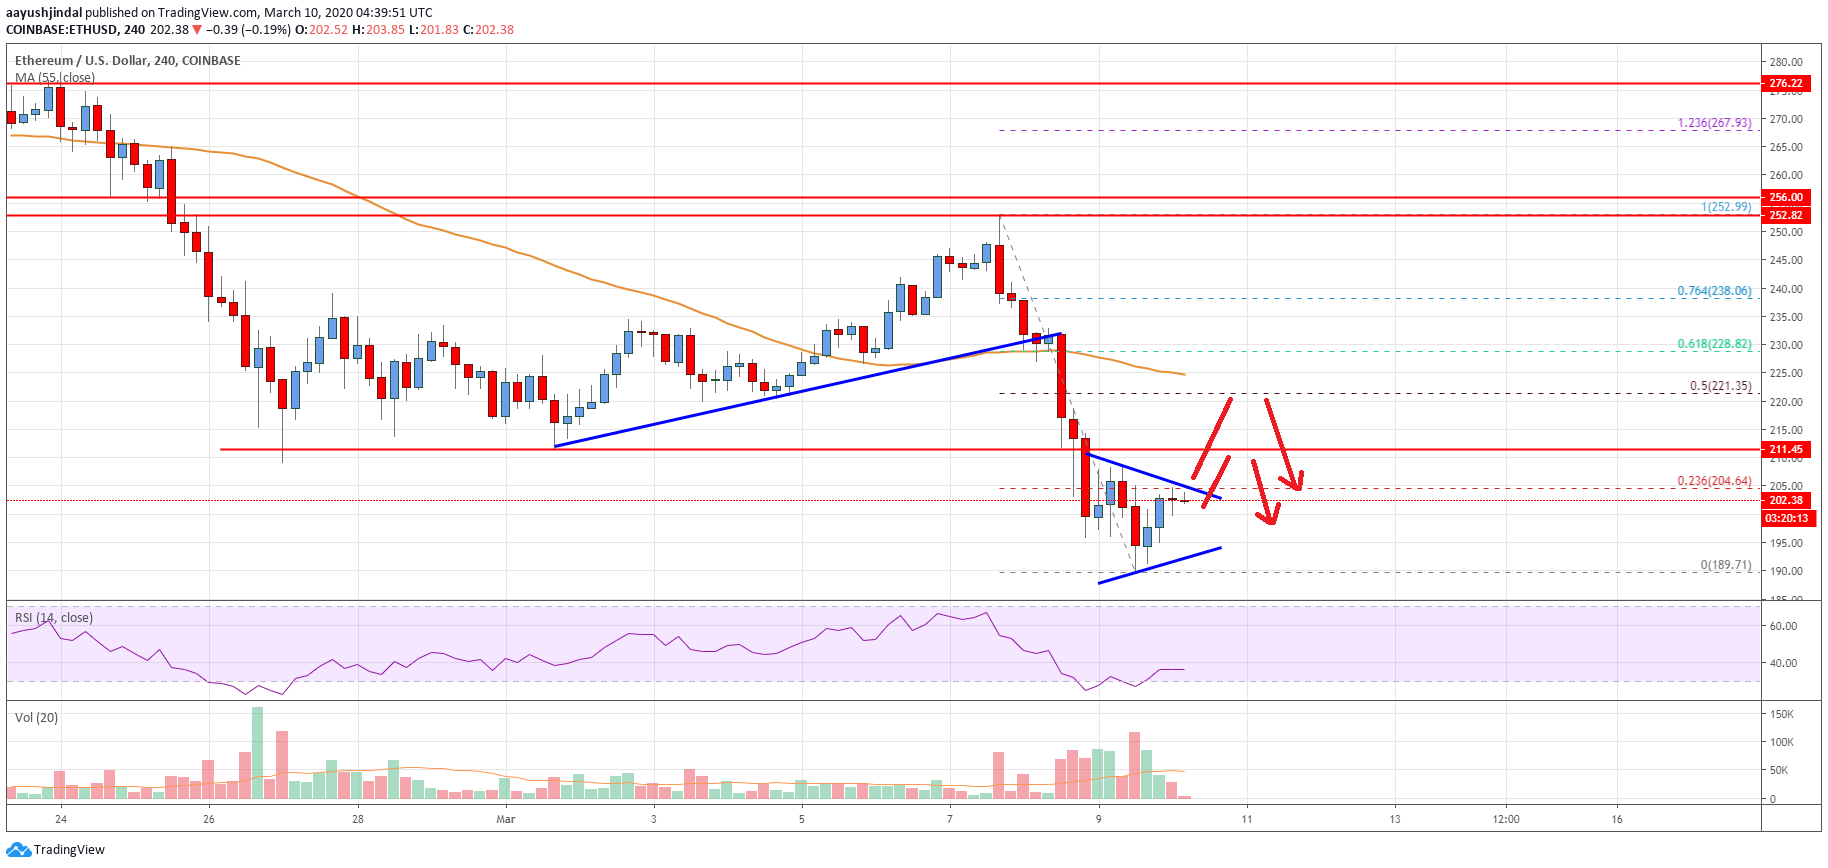
- There is a short term contracting triangle forming with resistance near $204 on the 4-hours chart (data feed from Coinbase).
- The price is likely to facing a lot of hurdles on the upside near the $211 and $220 levels in the near term.
Ethereum price is now trading in a bearish zone against the US Dollar. ETH/USD could correct higher, but upsides are likely to remain capped near the $211 and $220 levels.
Ethereum Price Analysis
In the past few days, there was a steady decline in Ethereum price below the key $220 support against the US Dollar. ETH price even settled below the $220 level and the 55 simple moving average (4-hours).
Finally, the price traded below the $200 support level and formed a new monthly low near the $189 level. It is currently correcting higher above the $192 and $195 levels.
It seems like the price is consolidating losses below the $204 and $205 resistance levels. The 23.6% Fib retracement level of the downward move from the $2752 high to $189 low is also near the $204 level.
More importantly, there is a short term contracting triangle forming with resistance near $204 on the 4-hours chart. If there is an upside break above the triangle resistance and $205, the price could recover towards the $211 resistance area.
The next major resistance is near the $221 level. It coincides with the 50% Fib retracement level of the downward move from the $2752 high to $189 low.
The final hurdle for Ethereum could be near the $225 level and the 55 simple moving average (4-hours). Therefore, a successful close above $211 and a follow through above the $220 resistance zone is needed for a fresh uptrend.
Conversely, the price is likely to fail near the $211 resistance area. In the mentioned case, the bears are likely to aim more losses below the $192 and $190 levels. The next major support is near the $182 and $180 levels.
Looking at the chart, Ethereum price is currently correcting losses from the $189 low. However, there are many hurdles on the upside near the $211 and $220 levels, where the bears are likely to appear again.
Technical indicators
4 hours MACD – The MACD for ETH/USD is currently losing momentum in the bearish zone.
4 hours RSI (Relative Strength Index) – The RSI for ETH/USD is now just above the 30 level.
Key Support Levels – $192, followed by the $180 zone.
Key Resistance Levels – $211 and $220.


Leave a Reply
You must be logged in to post a comment.