Key Points
- Ethereum price declined heavily after forming a top near the $125 level against the US Dollar.
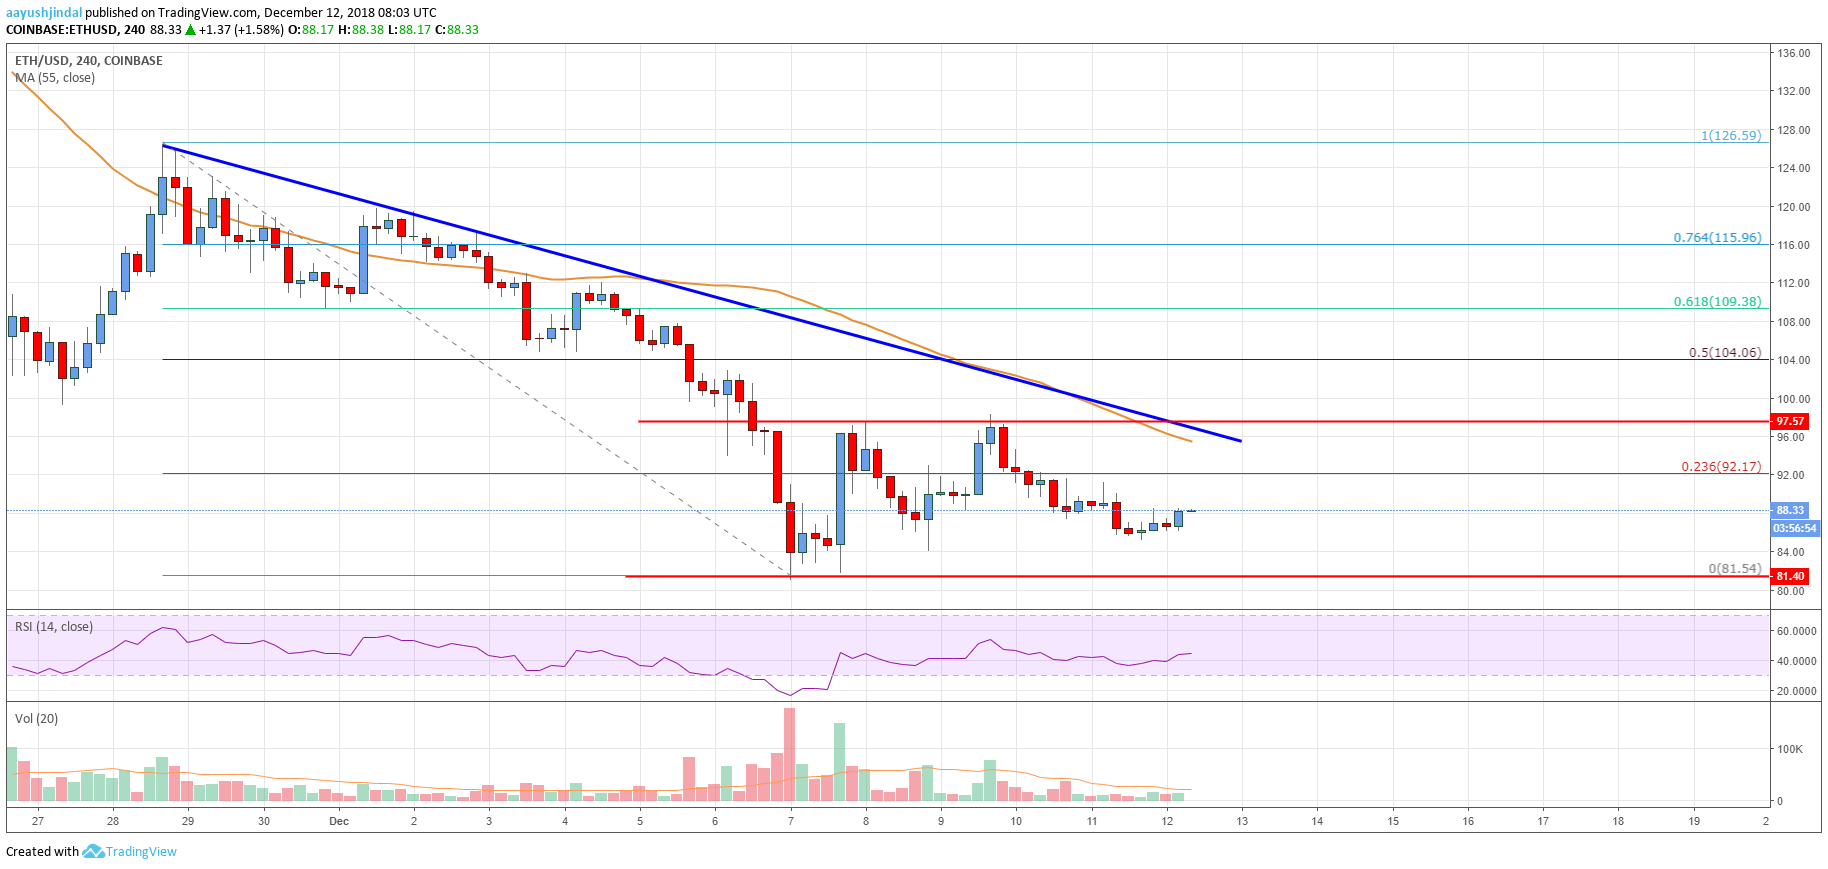
- There is a major bearish trend line formed with resistance near $96 on the 4-hours chart of the ETH/USD pair (data feed from Coinbase).
- The price is likely to correct higher, but it may face a strong resistance near $96-97.
Ethereum price is in a downtrend below the $100 level against the US Dollar. ETH is likely to face a strong barrier near the $97 level if there is an upside correction.
Ethereum Price Analysis
There was a major decline initiated from the $126 level in Ethereum price against the US Dollar. The ETH/USD pair declined heavily during the past few days and broke the $110, $100 and $90 support levels. A new yearly low was formed at $51.54 and later the price started consolidating losses. It corrected a few points and traded above the $88 and $90 levels. There was also a break above the 23.6% Fib retracement level of the last decline from the $126 high to $81 low.
However, the price struggled to gain pace above $97 and it stayed well below the 55 simple moving average (4-hours). More importantly, there is a major bearish trend line formed with resistance near $96 on the 4-hours chart of the ETH/USD pair. The trend line coincides with the $97 resistance zone and the 55 simple moving average (4-hours). Therefore, it won’t be easy for buyers to clear the $96-97 resistance zone. Above $97, the price could test the 50% Fib retracement level of the last decline from the $126 high to $81 low.

Looking at the chart, Ethereum price remains in a downtrend and an upside correction could face sellers near $96 or $97.
Looking at the technical indicators:
4-hours MACD – The MACD for ETH/USD is still in the bearish zone.
4-hours RSI (Relative Strength Index) – The RSI is just near the 50 level.
Key Support Level – $91
Key Resistance Level – $97


Leave a Reply
You must be logged in to post a comment.