
 Samuel·4d ago
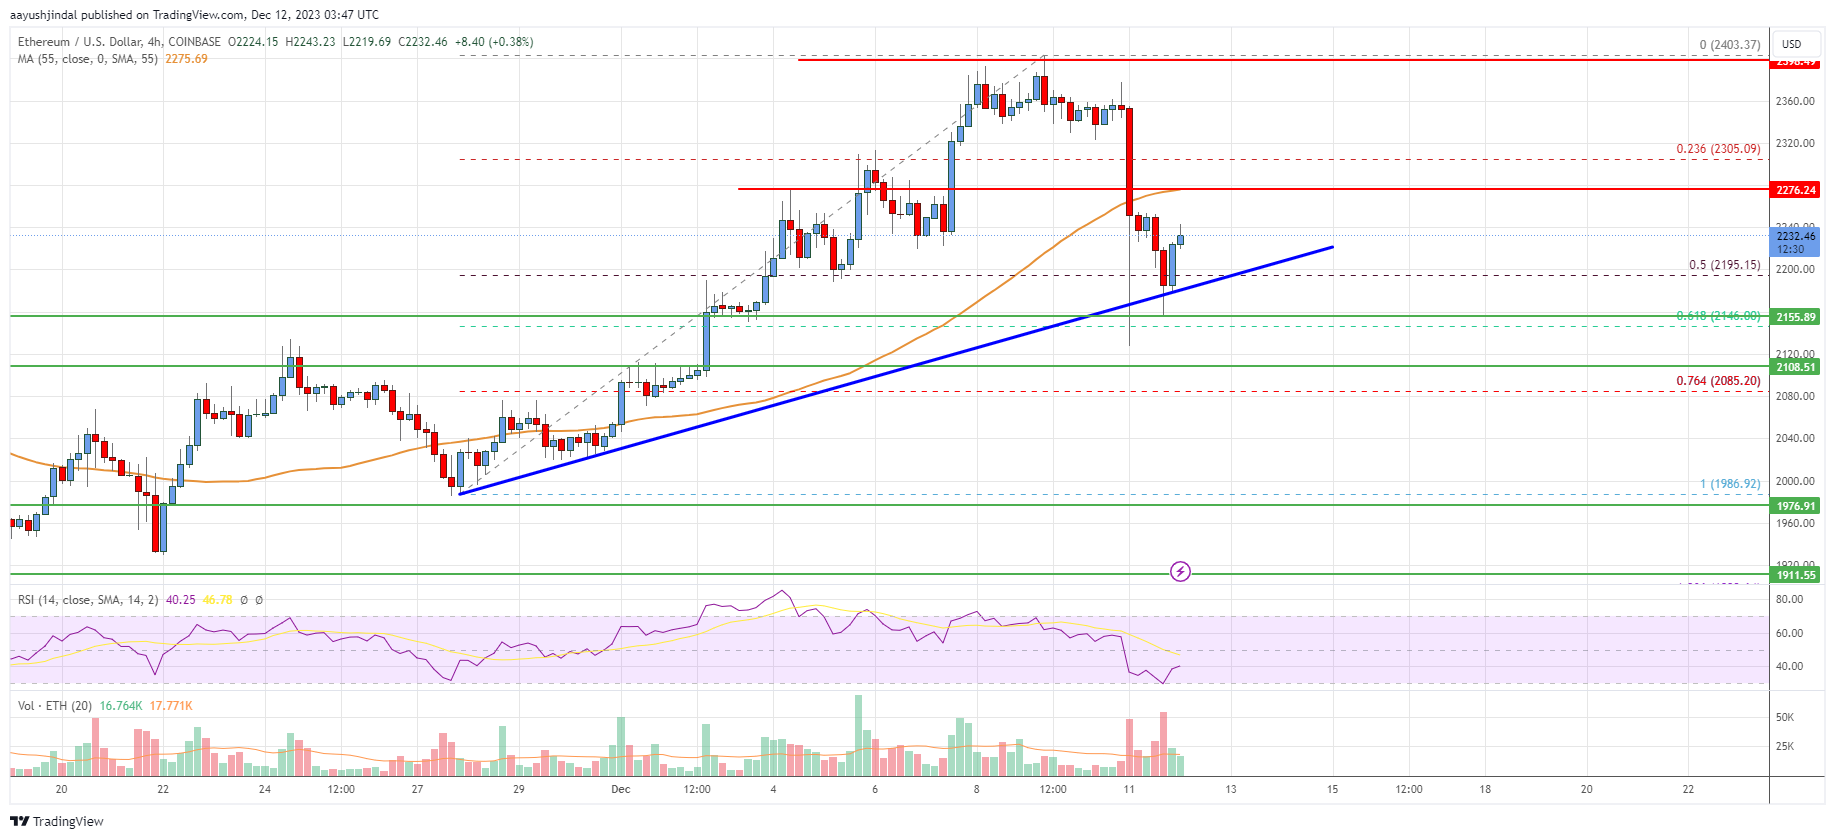
Session snapshot for 12 December 2023. This is a dated market note, not a reprint of earlier analyses that used the same headline.
Ethereum price is declining below $2,300 against the US Dollar. ETH/USD remains at a risk of more downsides below the $2,275 support zone.
In the past few weeks, Ethereum started a decent increase above the $2,200 resistance zone against the US Dollar. ETH price climbed above the $2,250 and $2,300 resistance levels.
Finally, it tested the $2,400 resistance zone. A high was formed near $2,403 before there was a downside correction. There was a move below the $2,300 support zone. The price even traded below the 50% Fib retracement level of the upward move from the $1,986 swing low to the $2,403 high.
ETH is now trading below $2,300 and the 55 simple moving average (4 hours). There is also a key bullish trend line forming with support at $2,195 on the 4-hour chart.
On the upside, the price is now facing resistance near the $2,275 level. The next major resistance is near the $2,300 level. The next major resistance is near the $2,320 zone. A clear move above the $2,300 and $2,320 resistance levels might call for a fresh move to $2,400.
Any more gains could even send the price toward the $2,500 resistance zone or even $2,550 in the near term. On the downside, initial support is near the $2,195 level and the trend line.
The next major support is now near the $2,100 level or the 61.8% Fib retracement level of the upward move from the $1,986 swing low to the $2,403 high. A break below the $2,100 support could push the price to $2,000. If the bulls fail to protect the $2,000 support, the price might decline toward $1,920.
Looking at the chart, Ethereum price is clearly trading below $2,300 and the 55 simple moving average (4 hours). Overall, Ether price could continue to move down if it breaks the $2,100 support zone.
4 hours MACD – The MACD for ETH/USD is now losing momentum in the bullish zone.
4 hours RSI (Relative Strength Index) – The RSI for ETH/USD is now below the 50 level.
Key Support Levels – $2,195, followed by the $2,100 zone.
Key Resistance Levels – $2,300 and $2,350.
Related News
Explore more