- Ethereum price is currently holding the key $124 support area against the US Dollar.
- ETH price seems to be struggling to clear the $134 and $135 resistance levels.
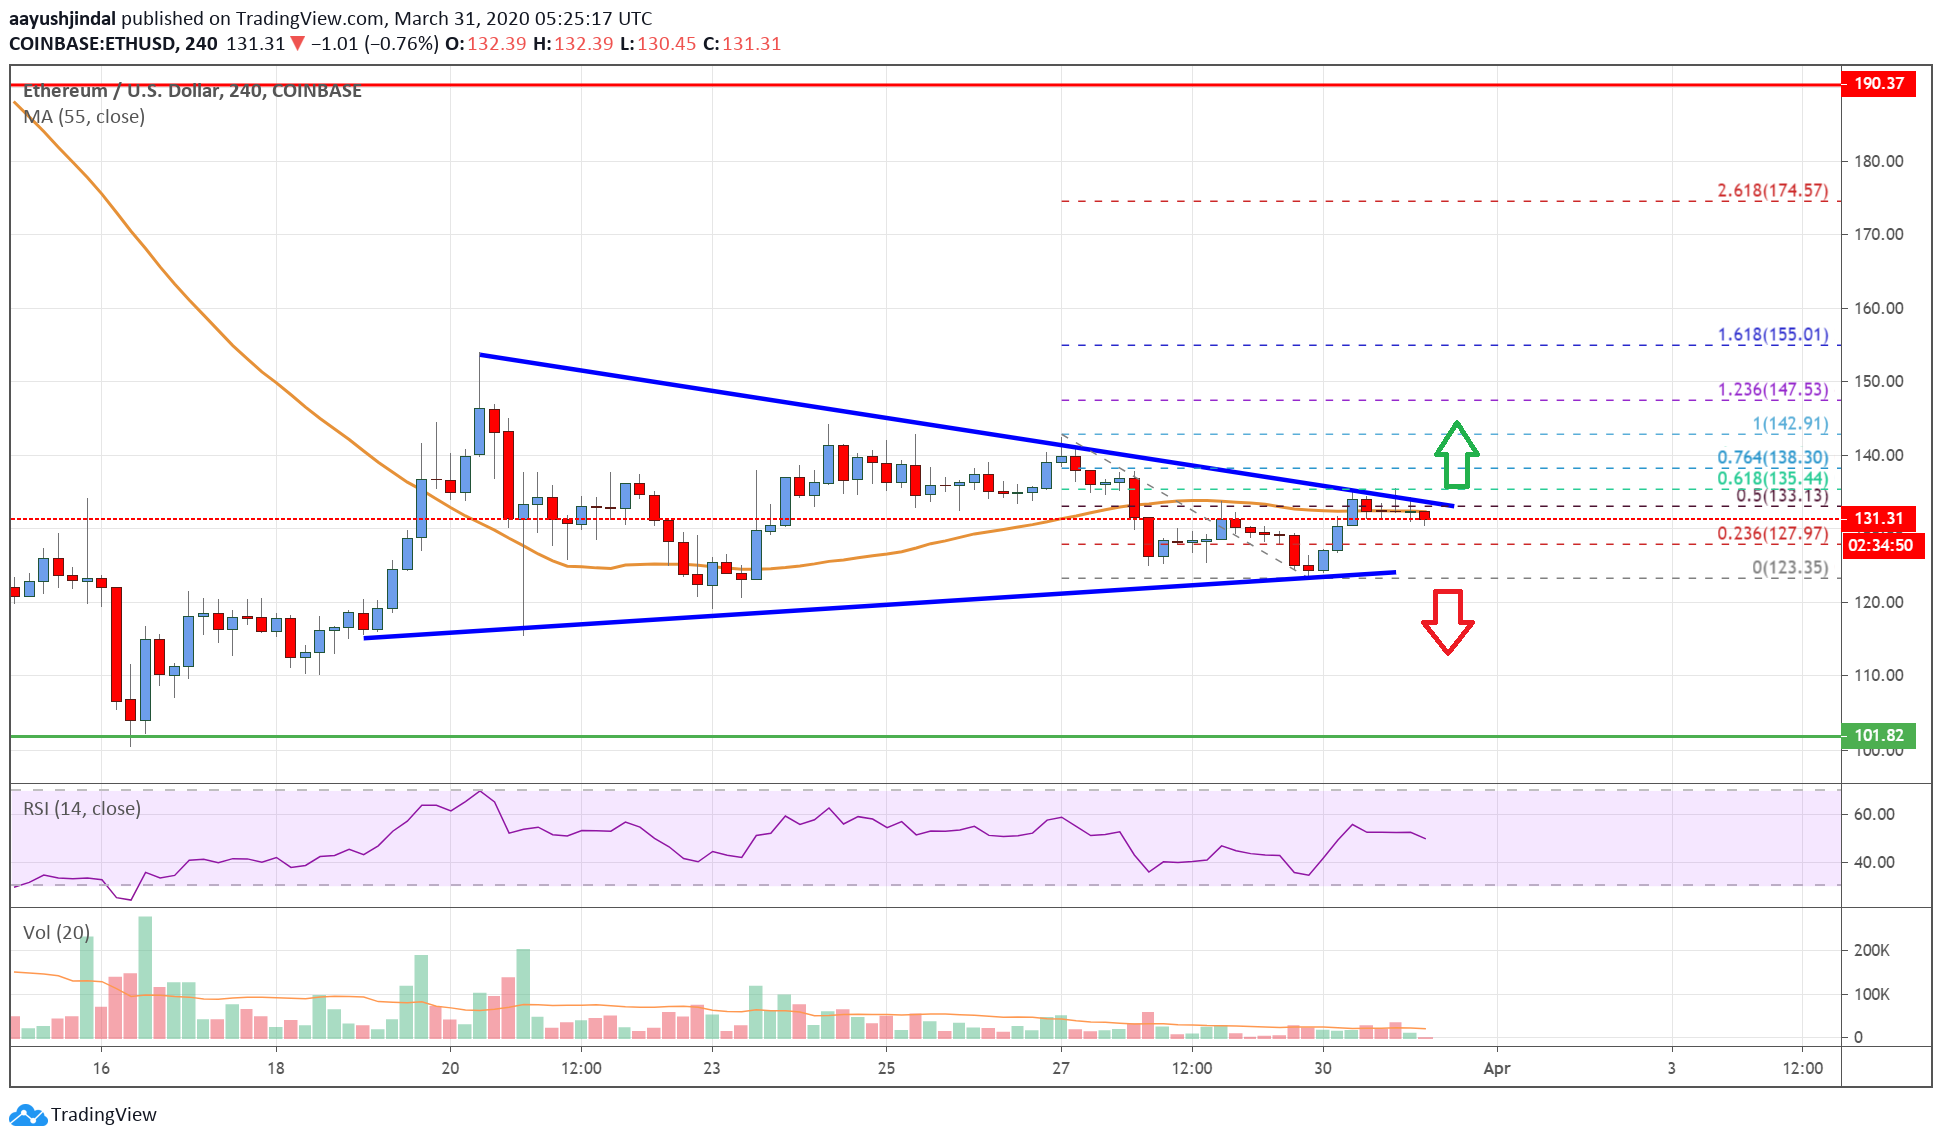
- There is a major contracting triangle forming with resistance near $134 on the 4-hours chart (data feed from Coinbase).
- The price could either rally above $135 or it might dive back towards the $110 support area.
Ethereum price is trading in a range and preparing for the next move against the US Dollar. ETH/USD must gain traction above $135 for a strong upward move.
Ethereum Price Analysis
After struggling to stay above the $140 level, Ethereum price started a downside correction against the US Dollar. ETH price topped near the $142 level and it traded below the $135 support area.
Besides, it broke the $130 level and the 55 simple moving average (4-hours). The price tested the $124 zone and it is currently correcting higher. There was a break above the $130 zone.
The bulls pushed the price above the 50% Fib retracement level of the downward move from the $143 swing high to $123 swing low. However, the price seems to be facing a strong barrier near the $134 and $135 levels.
The 61.8% Fib retracement level of the downward move from the $143 swing high to $123 swing low is also acting as a resistance. It seems like there is a major contracting triangle forming with resistance near $134 on the 4-hours chart.
If there is an upside break above the key $134 and $135 resistance levels, there are chances of more upsides in the coming sessions. An initial resistance is near the $142 level. The next resistance on the upside is near the $152 and $155 levels.
Any further gains could lead the price towards the $168 level in the near term. Conversely, the price might fail to move above the $135 zone and it could slide below $130 and $124. The next major support is near the $120 level, below which it could revisit the $110 level.
Looking at the chart, Ethereum price is showing a few positive signs above the $124 and $130 levels. Having said that, the bulls must gain strength above $135 for a sustained upward move.
Technical indicators
4 hours MACD – The MACD for ETH/USD is currently losing momentum in the bullish zone.
4 hours RSI (Relative Strength Index) – The RSI for ETH/USD is sliding towards the 50 level.
Key Support Levels – $124, followed by the $110 zone.
Key Resistance Levels – $135 and $142.
