
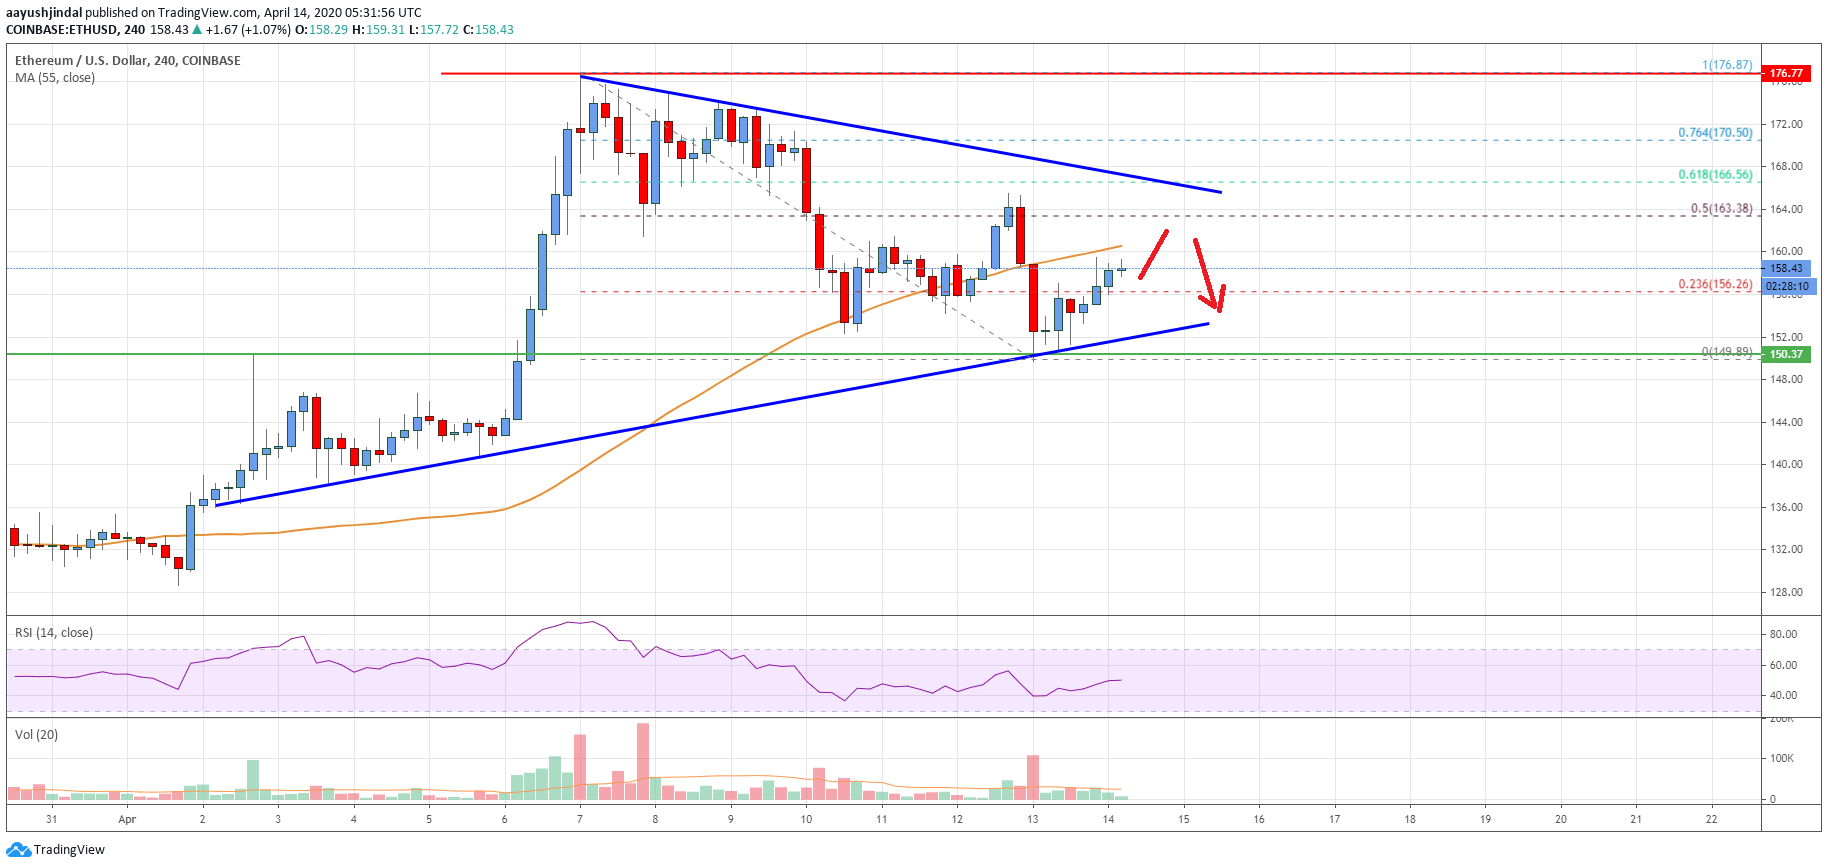
- Ethereum price is currently recovering from the $150 support area against the US Dollar.
- ETH price is likely to fail near the $160 and $164 resistance levels in the near term.
- There is a crucial contracting triangle forming with resistance near $165 on the 4-hours chart (data feed from Coinbase).
- The price could correct a few points, but it is likely to struggle near the $164-$165 resistance area.
Ethereum price is showing a few bearish signs below the $165 pivot level against the US Dollar. ETH/USD remains at a risk of more losses as long as it is below $165 and $168.
Ethereum Price Analysis
After forming a key top near the $176 level, Ethereum price started a fresh decline against the US Dollar. ETH price broke the $168 and $165 support levels to move into a short term bearish zone.
Besides, there was a close below the $160 level and the 55 simple moving average (4-hours). The price traded to a new multi-week low and tested the $150 support area.
Recently, the price formed a support base above $150 and started an upside correction. There was a break above the $152 and $155 levels. Ethereum also climbed above the 23.6% Fib retracement level of the main decline from the $176 high to $150 swing low.
On the upside, an initial hurdle for the bulls is seen near the $160 level and the 55 simple moving average (4-hours). The next key hurdle is near the $164 level since it is close to the 50% Fib retracement level of the main decline from the $176 high to $150 swing low.
More importantly, there is a crucial contracting triangle forming with resistance near $165 on the 4-hours chart. Therefore, the price is likely to struggle near the $164-$165 resistance area if it corrects higher in the near term.
A successful close above the $165 resistance area is needed for a convincing upward move. In the mentioned case, the price is likely to test the $175 resistance zone.
Conversely, the price might fail to climb above $165 and it could decline further. A clear break below the $152 and $150 support levels is likely to lead the price towards $140.
Looking at the chart, Ethereum price is showing many bullish signs above the $168 and $158 support levels. Therefore, it could continue to rise towards $188 unless there is a break below $158.
Technical indicators
4 hours MACD – The MACD for ETH/USD is currently losing momentum in the bearish zone.
4 hours RSI (Relative Strength Index) – The RSI for ETH/USD is correcting higher towards the 50 level.
Key Support Levels – $152, followed by the $150 zone.
Key Resistance Levels – $160 and $165.


Leave a Reply
You must be logged in to post a comment.