
- Ethereum price rallied recently above the $150 and $160 levels against the US Dollar.
- ETH price even surged above the $165 resistance and tested the $176 region.
- Earlier, there was a break above a key contracting triangle with resistance near $142 on the 4-hours chart (data feed from Coinbase).
- The price could correct a few points, but dips remain well supported near $164 or $158.
Ethereum price is now trading in a strong uptrend above $158 against the US Dollar. ETH/USD is likely to extend its rise towards the $188 level as long as it is above $158.
Ethereum Price Analysis
After forming a support base above the $130 level, Ethereum price started a fresh increase against the US Dollar. ETH price broke the key $150 resistance to move into a positive zone.
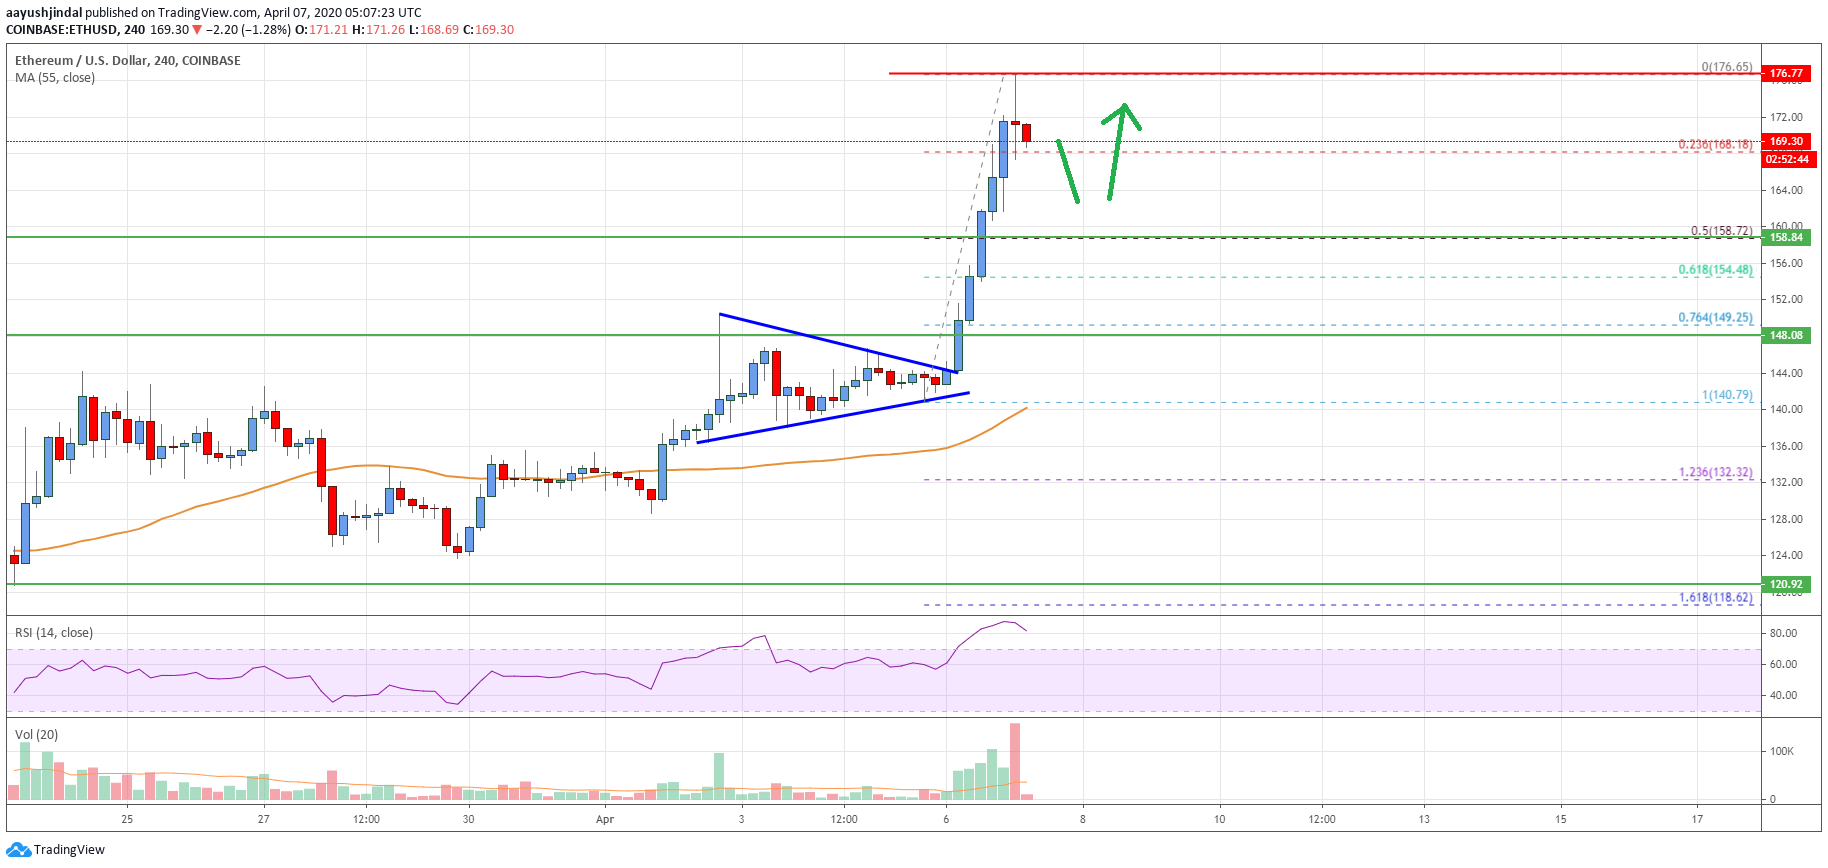
There was a close above the $158 level and the 55 simple moving average (4-hours). Earlier, there was a break above a key contracting triangle with resistance near $142 on the 4-hours chart. The price surged above the $165 resistance and tested the $175-$176 region.
A new monthly high is formed near $176 and the price is currently correcting gains. It traded below the $172 and $170 levels. An initial support is seen near the $168 level. It coincides with the 23.6% Fib retracement level of the recent rally from the $140 low to $176 high.
If there is a downside extension below the $168 support, the price could continue to move down towards the $158 support level. It is also close to the 50% Fib retracement level of the recent rally from the $140 low to $176 high.
Any further losses may perhaps lead ether price towards the $150 support. The main uptrend support is now forming near the $148 level.
On the upside, an initial resistance is near the $172 level. The key hurdle for the bulls is near the $175 level, above which the price is likely to surge above $180. The next major barrier is seen near the $188 level.
Looking at the chart, Ethereum price is showing many bullish signs above the $168 and $158 support levels. Therefore, it could continue to rise towards $188 unless there is a break below $158.
Technical indicators
4 hours MACD – The MACD for ETH/USD is currently losing momentum in the bullish zone.
4 hours RSI (Relative Strength Index) – The RSI for ETH/USD is correcting lower from the 75 level.
Key Support Levels – $168, followed by the $158 zone.
Key Resistance Levels – $175 and $188.


Leave a Reply
You must be logged in to post a comment.