- Ethereum price declined heavily after it broke the key $264 support area against the US Dollar.
- ETH price even traded below the $240 support area and tested the $203 level.
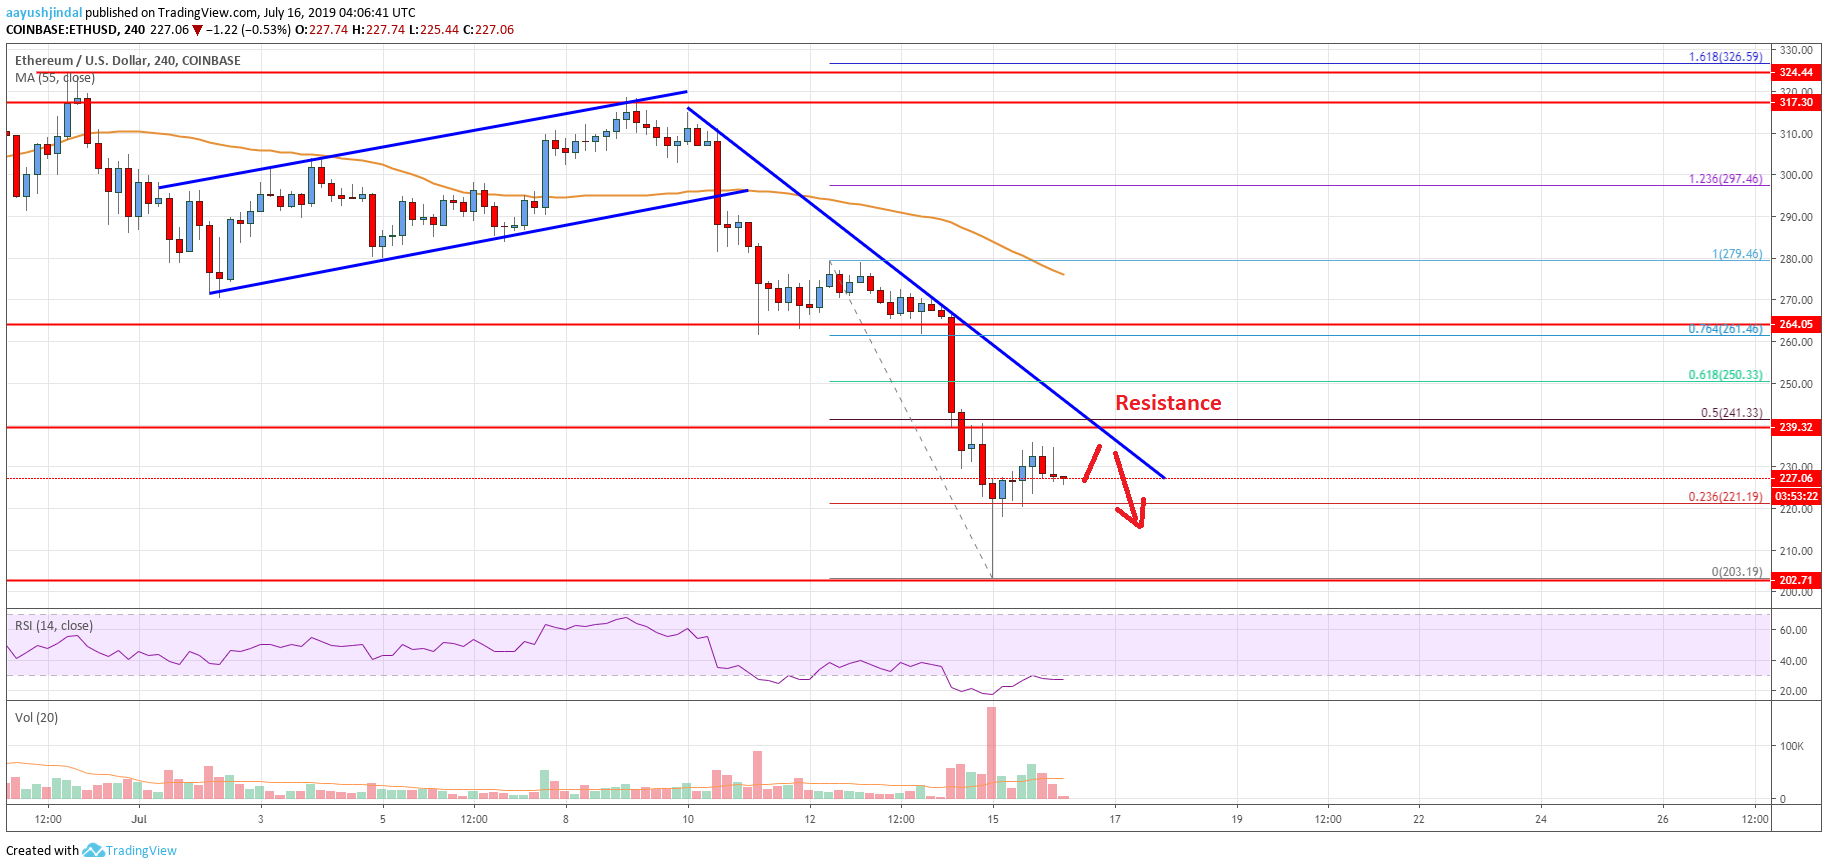
- There is a major bearish trend line forming with current resistance near $240 on the 4-hours chart (data feed from Coinbase).
- The price remains at a risk of more losses as long as it is trading below the $240 resistance area.
Ethereum price nosedived recently and traded close to the $200 handle against the US Dollar. ETH price is currently correcting higher, but it is likely to struggle near $240.
Ethereum Price Analysis
After a downside break below the $295 support, Ethereum price started a major drop against the US Dollar. The ETH/USD pair broke an ascending channel with support near $295 to enter a bearish zone. Later, the price broke the key $264 support level. As a result, there was a sharp drop below the $250 support and the 55 simple moving average (4-hours). Finally, the price broke the $220 support level and traded close to the $200 handle.
A new monthly low was formed near $203 and the price recently corrected higher. It broke the $215 level and the 23.6% Fib retracement level of the recent decline from the $279 high to $203 low. However, the price is facing a lot of hurdles near $235, $238 and $240. Moreover, there is a major bearish trend line forming with current resistance near $240 on the 4-hours chart.
The 50% Fib retracement level of the recent decline from the $279 high to $203 low is also near the $240 zone to act as a resistance. Therefore, the price must clear the trend line and the $240 area to move back into a positive zone. If there is a break above $240, the price could climb back above the $250 level. The next key resistance is near the $262 and $264 levels.
On the flip side, if the price fails to climb above $238 or $240, it could start a fresh decline. An initial support on the downside is near the $215 level, below which the price may decline towards the $200 handle.

Looking at the chart, Ethereum price is clearly trading in a bearish zone below the $240 level. As long as the price is below $238 and $240, it remains at a risk of more losses in the coming sessions.
Technical indicators
4 hours MACD – The MACD for ETH/USD is struggling to gain pace in the bullish zone.
4 hours RSI (Relative Strength Index) – The RSI for ETH/USD is still well below the 30 and 40 levels.
Key Support Levels – $215, followed by the $200 zone.
Key Resistance Levels – $240 and $264.


Leave a Reply
You must be logged in to post a comment.