- Tron price declined heavily after it broke the key $0.0310 support level against the US Dollar.
- TRX price traded below many supports, including $0.0305, $0.0280 and $0.0250.
- There is a major declining channel forming with resistance near $0.0265 on the 4-hours chart (data feed via Bitfinex).
- The price remains at a risk of more losses if there is a downside break below the $0.0235 level.
TRON price is under a lot of selling pressure against the US Dollar and bitcoin. TRX price may continue to slide if it fails to recover above the $0.0265 and $0.0280 resistances.
Tron Price Analysis
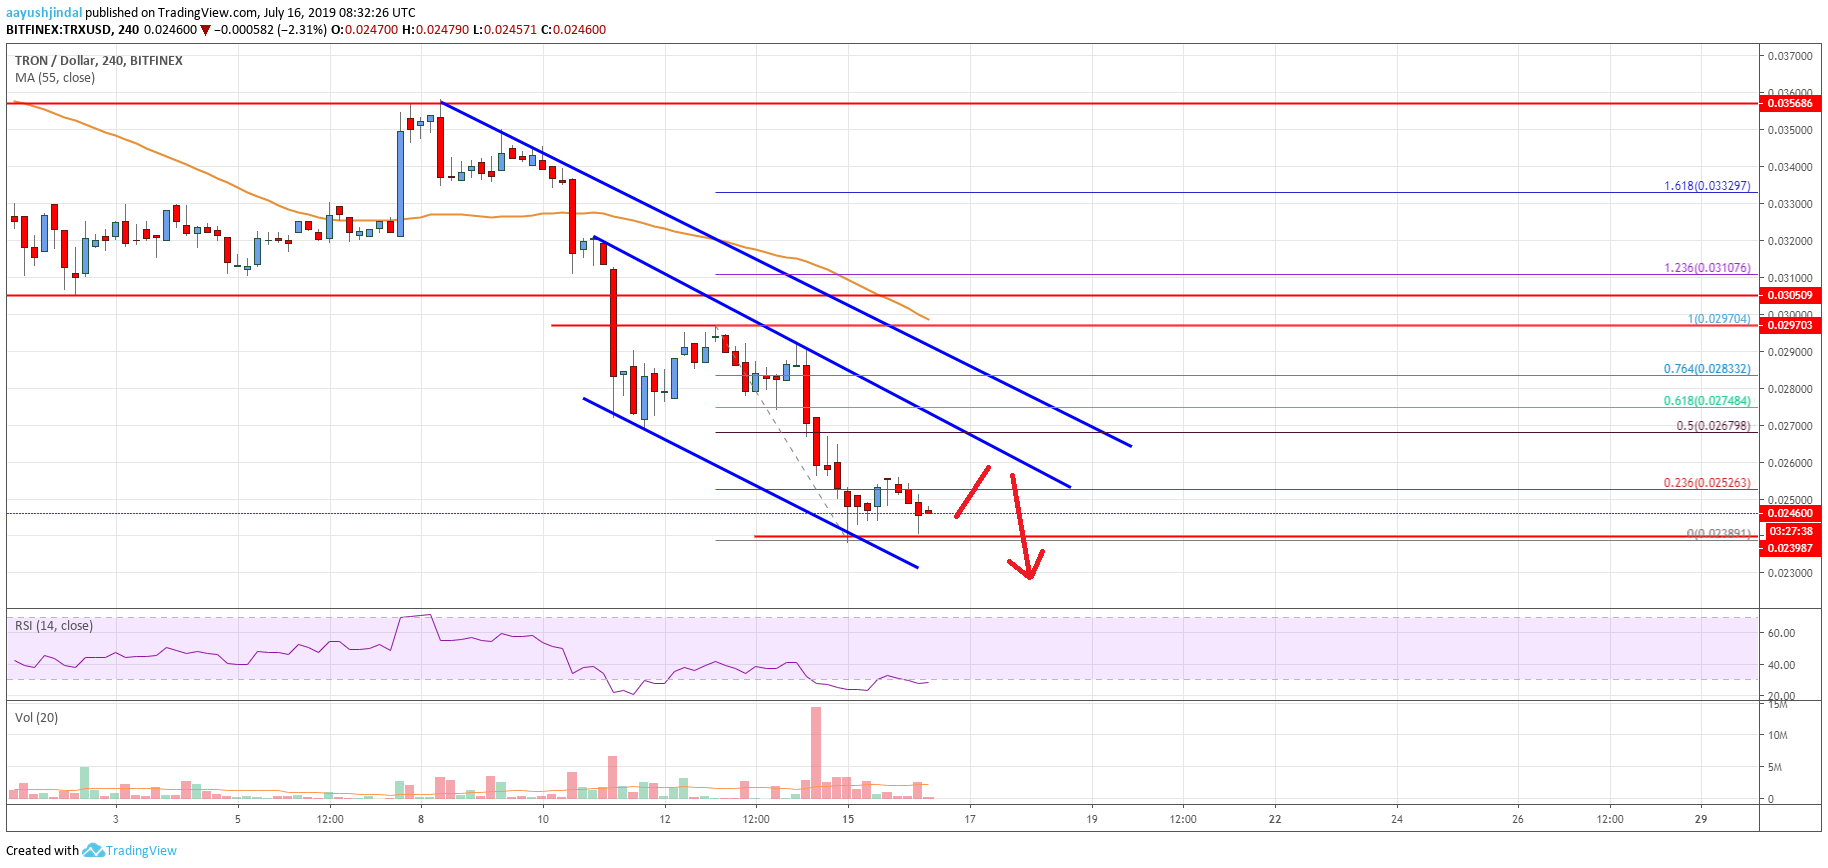
There was a significant downward move in TRON price after it broke the $0.0310 support against the US Dollar. The TRX/USD pair broke many supports near $0.0300 to move into a bearish zone. Moreover, the price even traded below the $0.0265 support level and settled well below the 55 simple moving average (4-hours). Finally, there was a spike below the $0.0250 level and a new monthly low was formed at $0.0238.
At the moment, the price is consolidating above the $0.0240 level. An immediate resistance is near the 23.6% Fibonacci retracement level of the recent decline from the $0.0297 high to $0.0238 low. On the upside, there are many important resistances near the $0.0265 level. Moreover, there is a major declining channel forming with resistance near $0.0265 on the 4-hours chart.
The 50% Fibonacci retracement level of the recent decline from the $0.0297 high to $0.0238 low is also near the $0.0267 level to act a key resistance. Finally, there is a crucial bearish trend line forming with resistance at $0.0270 on the same chart. If there is an upside break above the $0.0265 and $0.0270 resistance levels, the price may perhaps recover towards the $0.0305 and $0.0310 resistance levels.
On the downside, there is a major support forming near the $0.0235 and $0.0240 levels. If there is a downside break below $0.0235, the price might extend its decline. The next key support is near the $0.0210 level, below which the next stop for the bears is near the $0.0205 level.

The chart indicates that TRX price is clearly trading in a major downtrend below the $0.0265 level. If there is no recovery above $0.0265 and $0.0270, the price might continue to decline. The most important support for the bulls on the downside is near the $0.0200 level.
Technical Indicators
4 hours MACD – The MACD for TRX/USD is losing pace in the bearish zone.
4 hours RSI – The RSI for TRX/USD is currently moving higher towards the 40 level, with a bullish angle.
Key Support Levels – $0.0235 and $0.0210.
Key Resistance Levels – $0.0260, $0.0265 and $0.0270.


Leave a Reply
You must be logged in to post a comment.