- Ethereum price extended its rally above the $375 resistance zone against the US Dollar.
- ETH price is currently trading well above $370 and the 55 simple moving average (4-hours).
- There was a break above a key bullish flag pattern with resistance near $375 on the 4-hours chart (data feed from Coinbase).
- The pair is currently consolidating gains, but dips are likely to find support near $365.
Ethereum price is showing positive signs above $365 and $375 against the US Dollar. It seems like ETH/USD is preparing for more gains above the $395 and $400 levels.
Ethereum Price Analysis
After testing the $335 support two times, Ethereum price started a fresh increase against the US Dollar. ETH price broke a few key hurdles near the $355 resistance to move into a positive zone.
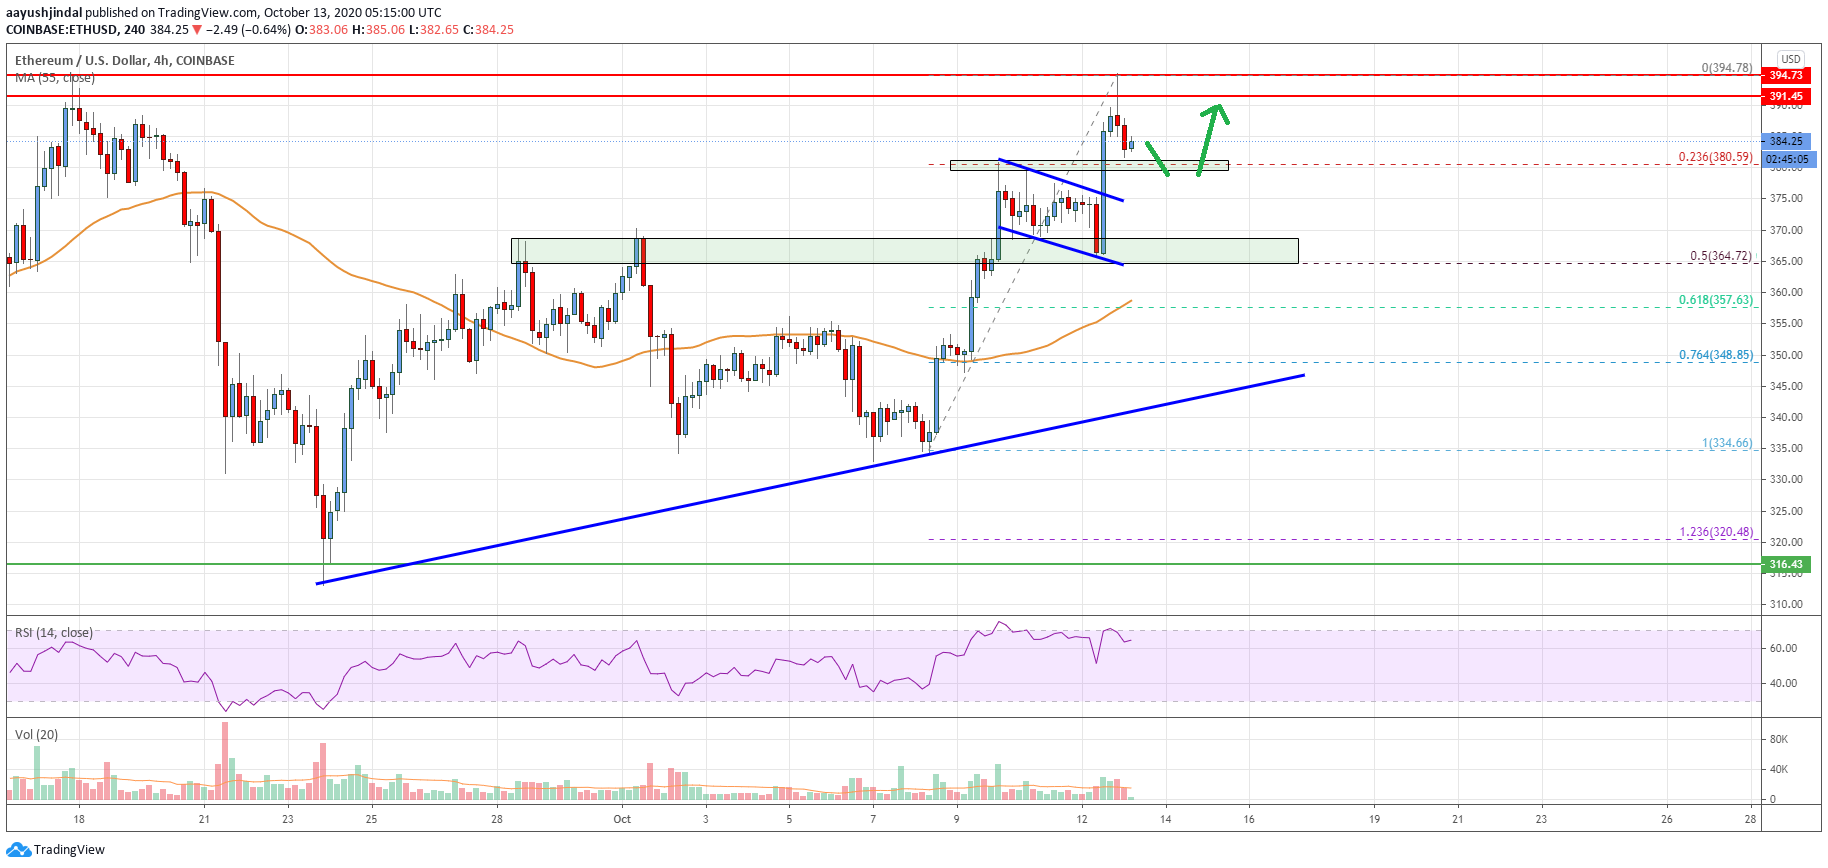
The bulls gained pace, resulting in a drift above the $365 level. Recently, there was a break above a key bullish flag pattern with resistance near $375 on the 4-hours chart. It opened the doors for more gains above the $380 and $385 levels.
The price tested the previous key hurdle near the $395 level. A high is formed near $395, and the price is currently trading well above $370 and the 55 simple moving average (4-hours).
An initial support is near the $381 level. It is close to the 23.6% Fib retracement level of the upward move from the $334 swing low to $395 high. The first major support is near the $375 level. Any further losses could lead the price towards the $365 support.
The 50% Fib retracement level of the upward move from the $334 swing low to $395 high is also near the $365 level to act as a strong support. The next major support for the bulls could be near $358 and the 55 simple moving average (4-hours).
On the upside, the price is facing hurdles near the $392 and $395 levels. A proper follow through move above the $395 resistance is likely to open the doors for a push above the $400 and $405 levels.
Looking at the chart, Ethereum price is clearly showing positive signs above $365 and the 55 simple moving average (4-hours). Overall, ether is currently consolidating gains, but dips are likely to find support near $365.
Technical indicators
4 hours MACD – The MACD for ETH/USD is placed nicely in the bullish zone.
4 hours RSI (Relative Strength Index) – The RSI for ETH/USD is currently above the 60 level.
Key Support Levels – $380, followed by the $365 zone.
Key Resistance Levels – $395 and $400.