- Ethereum price started an upside correction from the $335 support against the US Dollar.
- ETH price is currently struggling to clear the $355 resistance and trading near the 55 simple moving average (4-hours).
- There is a key bullish trend line forming with support near $352 on the 4-hours chart (data feed from Coinbase).
- The pair could either rally above the $355 resistance or it might start a fresh decline below $350.
Ethereum price is approaching a major breakout zone near $355 against the US Dollar. It seems like ETH/USD is preparing for the next crucial move if it clears $355.
Ethereum Price Analysis
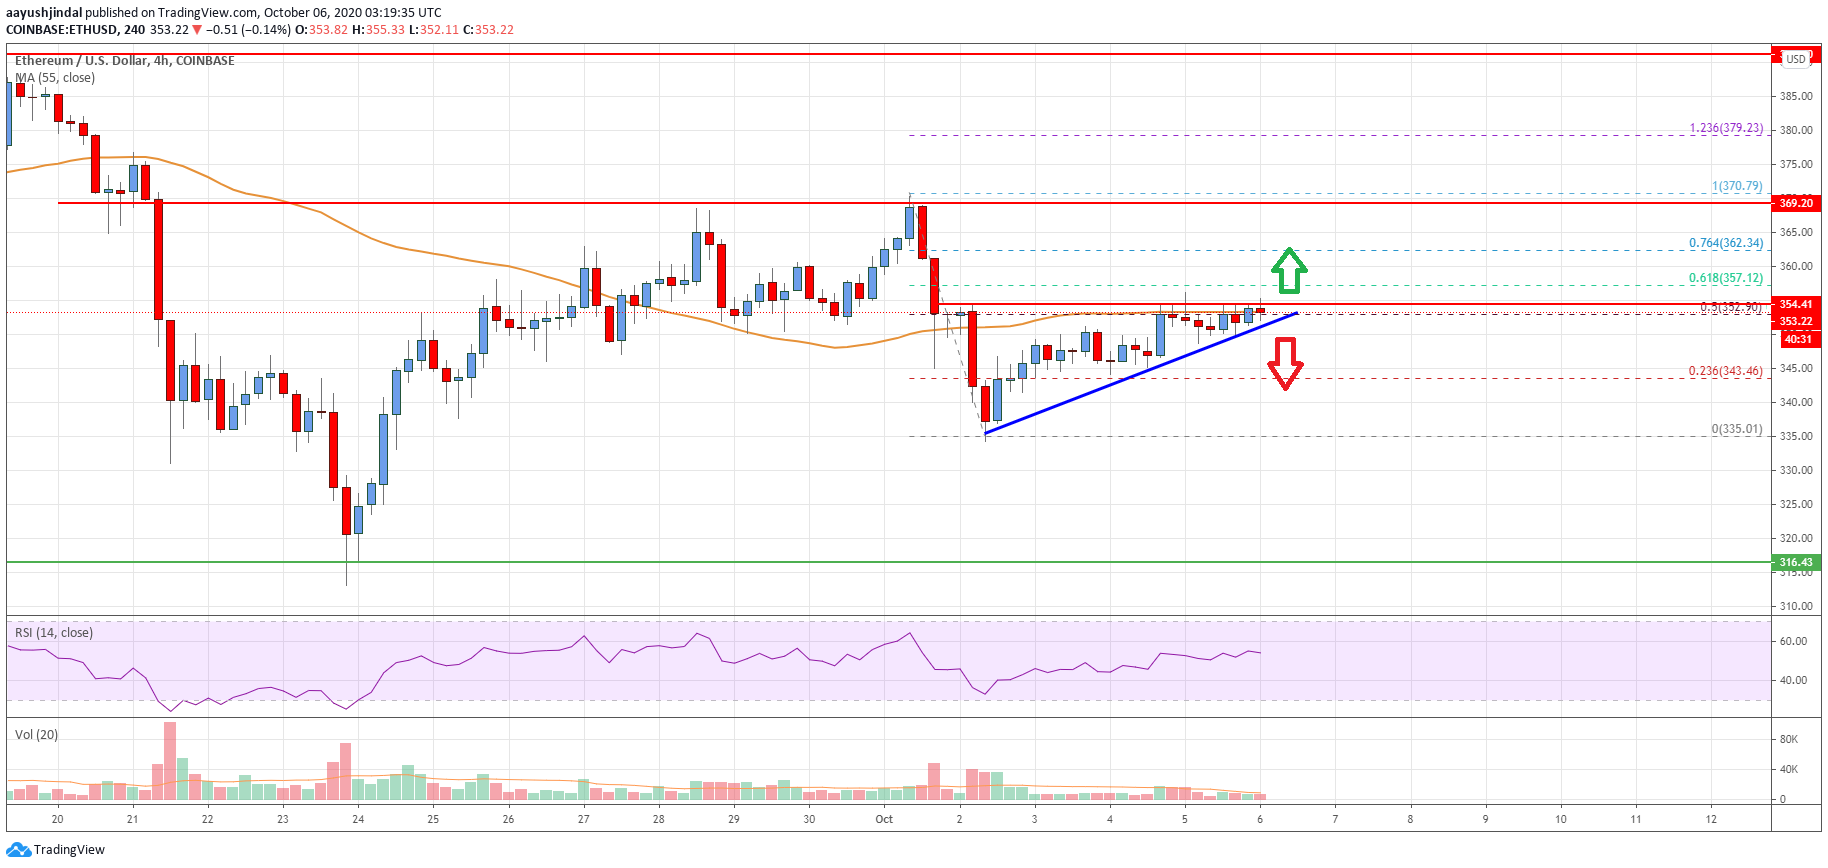
After another bearish wave, Ethereum price found support near the $335 level against the US Dollar. ETH price started a fresh upward move from the $335 support and recovered above $340.
The price climbed higher steadily above $340, and surpassed the 23.6% Fib retracement level of the downward move from the $370 swing high to $335 swing low. The price is now struggling to clear the $355 resistance and trading near the 55 simple moving average (4-hours).
The 50% Fib retracement level of the downward move from the $370 swing high to $335 swing low is also acting as a resistance. More importantly, it seems like there is a key bullish trend line forming with support near $352 on the 4-hours chart.
To continue higher, the price must settle above the $355 resistance level. The next key resistance is near the $362 level. Any further gains could open the doors for a larger upward move in the coming sessions.
Conversely, there are chances of a downside break below the trend line and the $350 support. In the stated bearish case, the price is likely to start a fresh decline towards the $335 support level.
A sustained downward move towards the $335 support may even increase the chances of more losses. The next major support below the $335 support could be near $320.
Looking at the chart, Ethereum price is clearly struggling to clear the $355 resistance and the 55 simple moving average (4-hours). Overall, the price could either rally above the $355 resistance or it might start a fresh decline below $350 in the near term.
Technical indicators
4 hours MACD – The MACD for ETH/USD is struggling to gain pace in the bullish zone.
4 hours RSI (Relative Strength Index) – The RSI for ETH/USD is currently above the 50 level.
Key Support Levels – $352, followed by the $350 zone.
Key Resistance Levels – $355 and $362.
