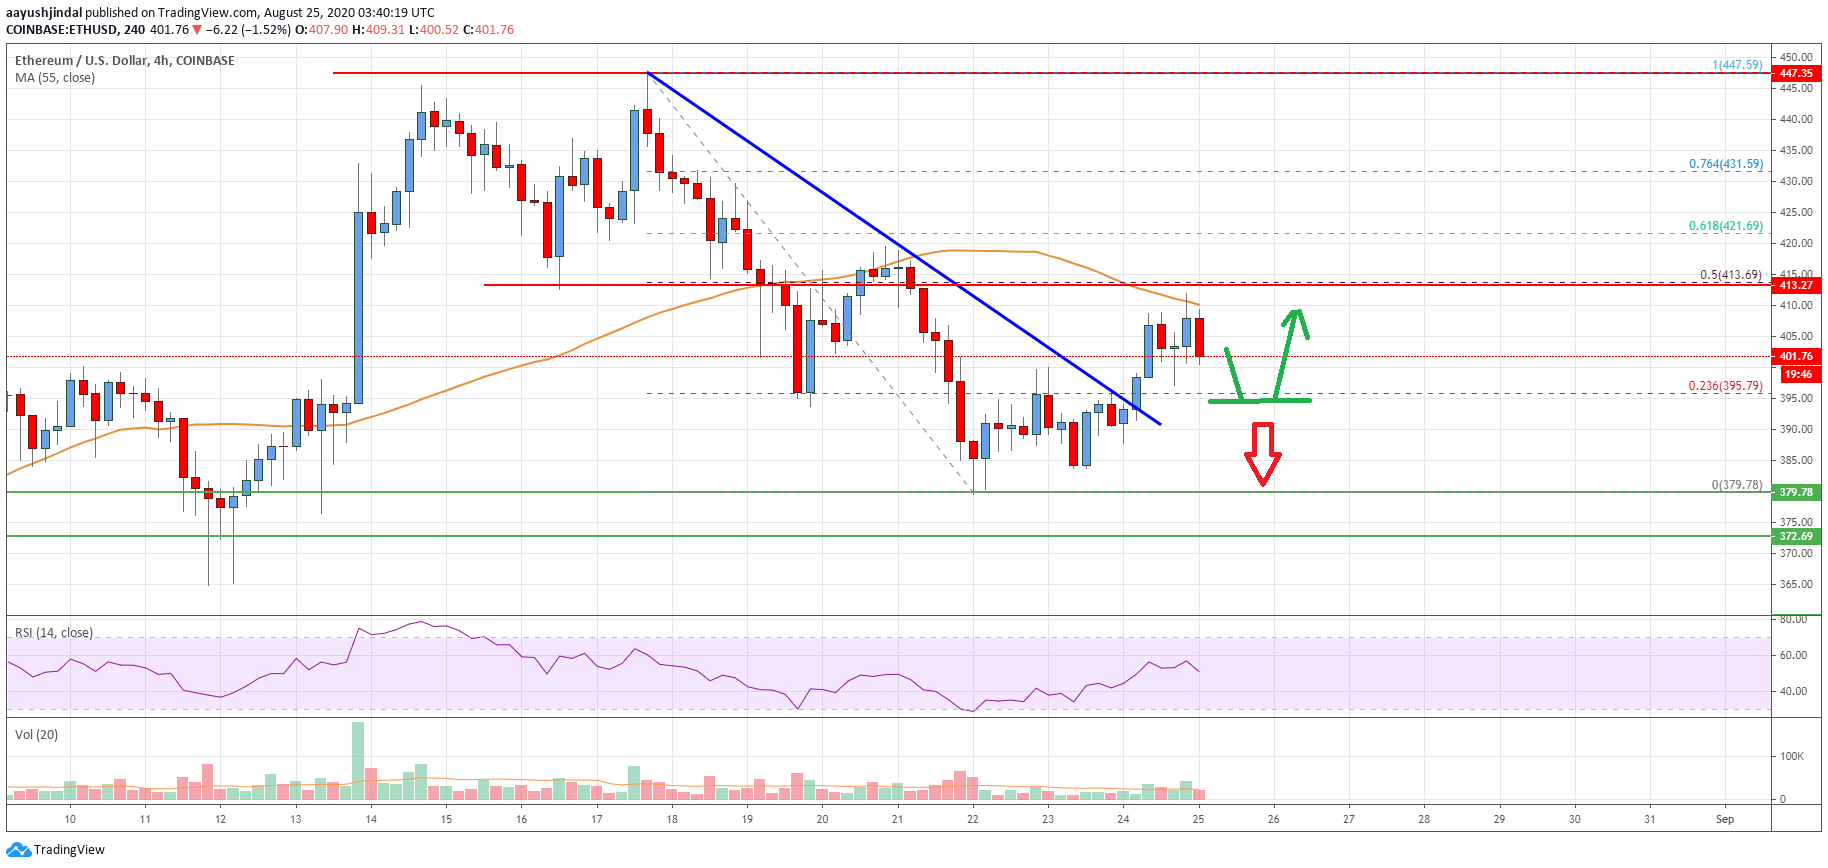
- Ethereum price started a fresh increase from the $380 support zone against the US Dollar.
- ETH price managed to recover above the $395 and $400 resistance levels.
- There was a break above a key connecting bearish trend line with resistance near $395 on the 4-hours chart (data feed from Coinbase).
- The pair is currently facing a strong resistance near $410 and the 55 simple moving average (4-hours).
Ethereum price is slowly recovering higher from $380 against the US Dollar. However, ETH/USD must clear the main $410 barrier to move back into a positive zone.
Ethereum Price Analysis
After a major downside correction, Ethereum price found support near the $380 level against the US Dollar. ETH price formed a support base above $380 and recently started a fresh increase.
It gained pace and broke the $395 resistance level. There was also a break above the 23.6% Fib retracement level of the downward move from the $447 high to $379 swing low. Moreover, there was a break above a key connecting bearish trend line with resistance near $395 on the 4-hours chart.
The pair even climbed above the $400 resistance. However, it is currently facing a strong resistance near $410 and the 55 simple moving average (4-hours). The 50% Fib retracement level of the downward move from the $447 high to $379 swing low is also near the $413 level to act as a hurdle.
A successful break above the $410 resistance zone and a close above the 55 simple moving average (4-hours) is must for a sustained upward move. The next key hurdles for the bulls are near $420 and $425.
Conversely, the price could start a fresh decline below the $402 and $400 support levels. In the mentioned case, the price could easily test the $380 support level again. Any further losses may perhaps push the price back into a bearish zone towards $362.

Looking at the chart, Ethereum price is clearly recovering higher and facing many hurdles near $410. Therefore, the price must gain pace above $410 and the 55 simple moving average (4-hours) to continue higher.
Technical indicators
4 hours MACD – The MACD for ETH/USD is slowly gaining momentum in the bullish zone.
4 hours RSI (Relative Strength Index) – The RSI for ETH/USD is currently just above the 50 level.
Key Support Levels – $400, followed by the $380 zone.
Key Resistance Levels – $410 and $420.


Leave a Reply
You must be logged in to post a comment.