- Ethereum price started a downside correction after it failed to clear the $400 barrier against the US Dollar.
- ETH price is currently declining and it is trading below the $380 support level.
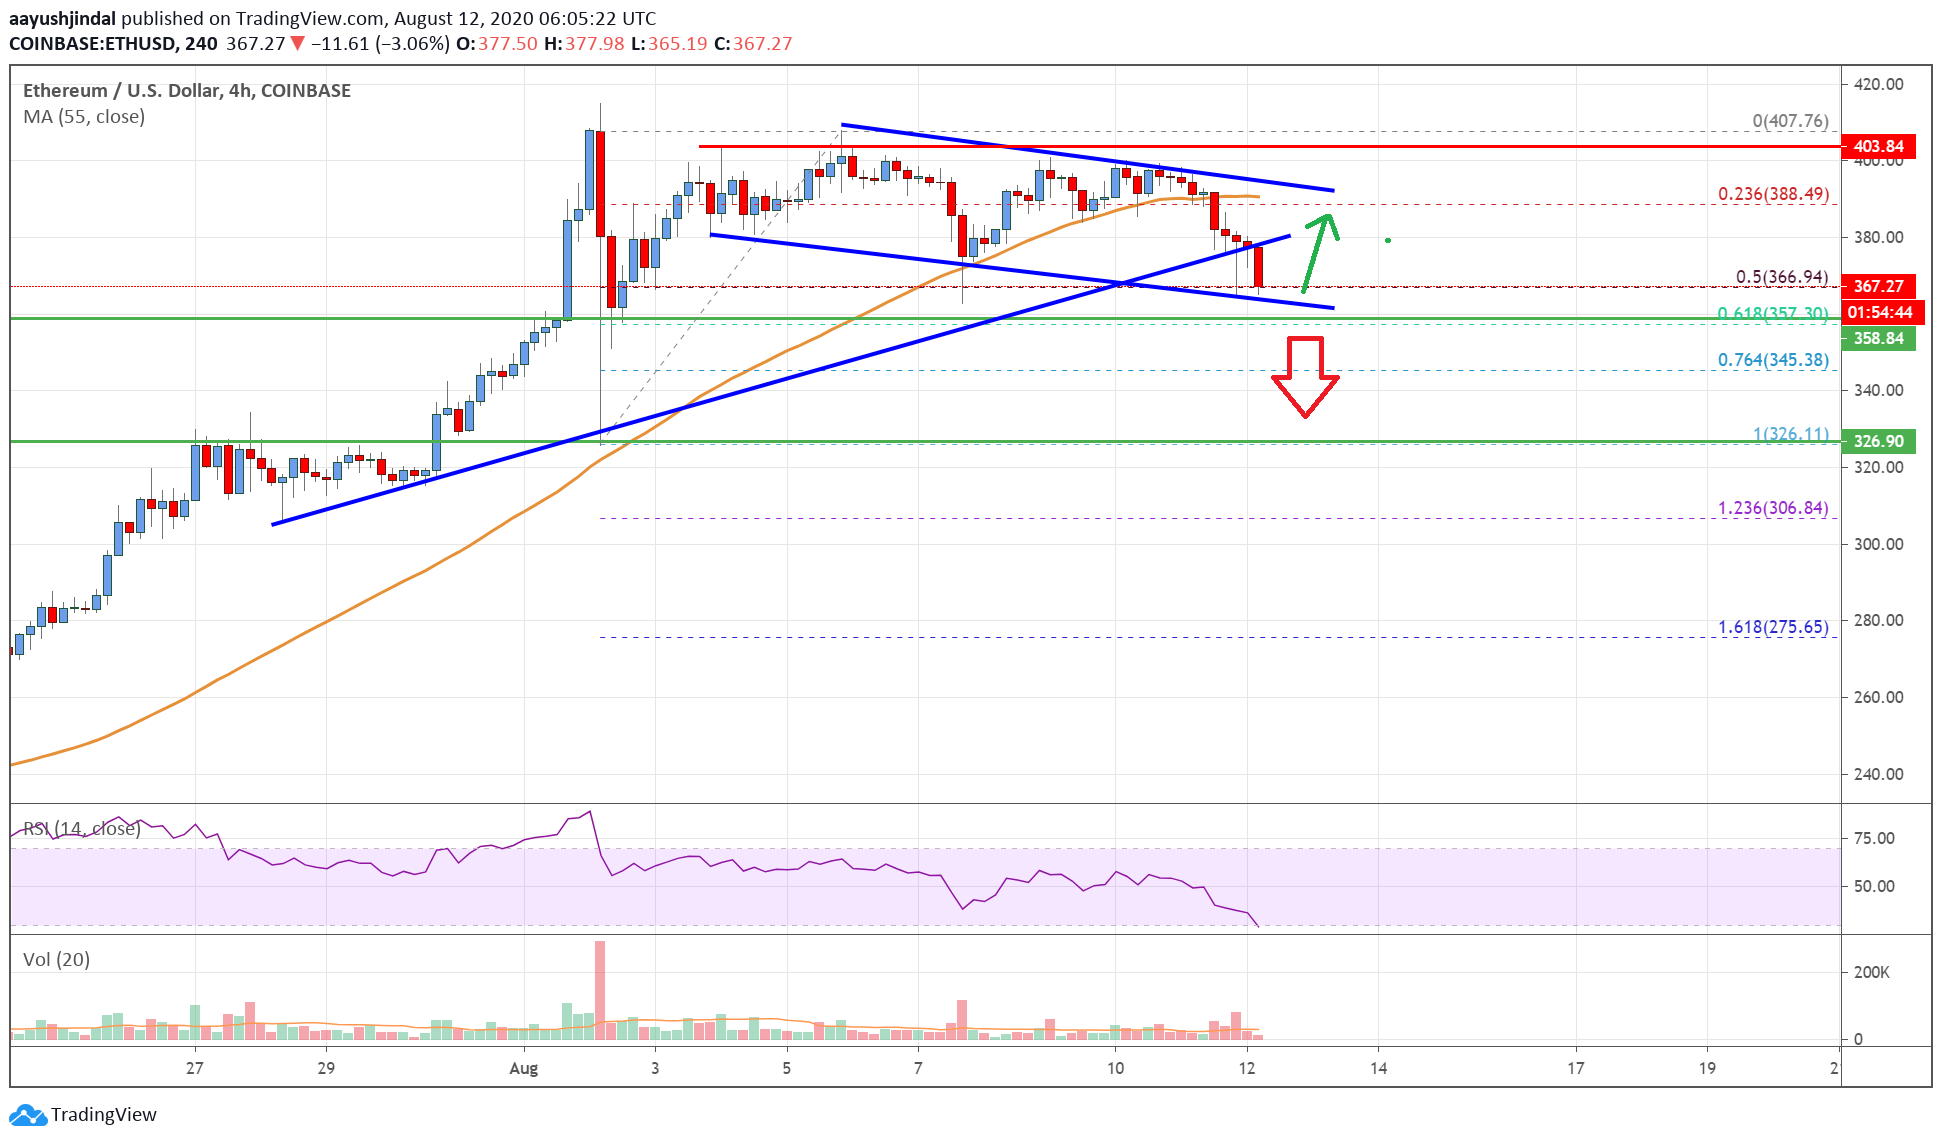
- There was a break below a major bullish trend line with support near $380 on the 4-hours chart (data feed from Coinbase).
- The pair is currently following a key declining channel and it is approaching the $365 support zone.
Ethereum price is currently correcting lower from the $400 barrier against the US Dollar. ETH/USD might revisit the $355 support zone before it starts a fresh increase.
Ethereum Price Analysis
In the past few days, Ethereum price made a couple of attempts to clear the $400 resistance area against the US Dollar. ETH price failed to continue higher and recently started a downside correction.
The price broke the key $380 support level and settled below the 55 simple moving average (4-hours). It gained bearish momentum below the 23.6% Fib retracement level of the upward move from the $326 swing low to $407 high.
Moreover, there was a break below a major bullish trend line with support near $380 on the 4-hours chart. The pair is now trading well below the $380 level and it is approaching a major support zone at $365.
The 50% Fib retracement level of the upward move from the $326 swing low to $407 high is also waiting near the $365 level to provide support. It seems like the price is currently following a key declining channel with support near the $365 level.
If there is a downside break below the channel support, the price could extend its decline towards the $355 support level. Any further losses may perhaps open the doors for a push towards the main $325 support level in the near term.
Conversely, the price could bounce back from the $365 support zone. On the upside, an initial resistance is near the $380 level. The main resistance is near $390 level, above which ether price might make another attempt to clear the $400 resistance.
Looking at the chart, Ethereum price is clearly approaching a major support zone near the $365 level. If it fails to stay above the $365 support, there is a risk of a sharp decline in the coming sessions.
Technical indicators
4 hours MACD – The MACD for ETH/USD is slowly gaining momentum in the bearish zone.
4 hours RSI (Relative Strength Index) – The RSI for ETH/USD is currently well below the 50 level.
Key Support Levels – $365, followed by the $355 zone.
Key Resistance Levels – $380 and $400.
