- Ethereum price started a solid rise above the $258 and $265 resistances against the US Dollar.
- ETH price seems to be facing a tough barrier near the $278-279 resistance zone.
- There is a crucial bullish trend line forming with support near $266 on the 4-hours chart (data feed from Coinbase).
- The price must stay above the $265 and $266 support levels to clear the $279 resistance area.
Ethereum price is placed nicely in an uptrend above $265 decline against the US Dollar. ETH could climb higher sharply once it surpasses the $278-279 resistance zone.
Ethereum Price Analysis
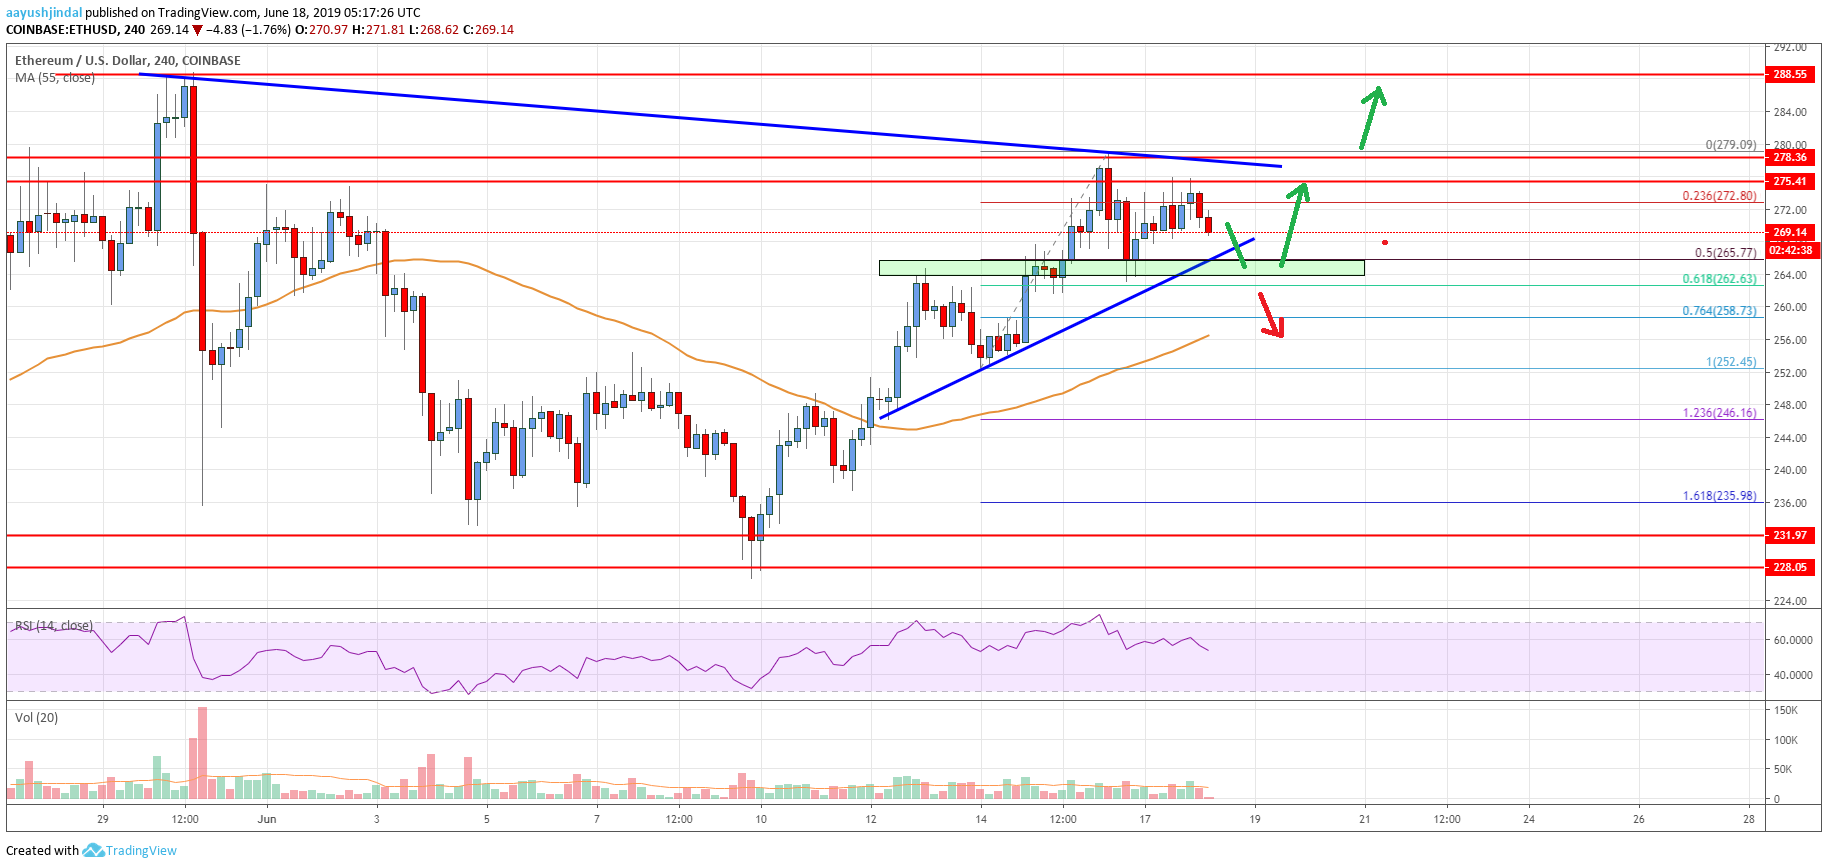
In the past few days, there was a steady rise in Ethereum price from the $252 swing low against the US Dollar. The ETH/USD pair traded above the $255 and $260 resistance levels. The pair even broke the $265 resistance and settled above the 55 simple moving average (4-hours). Finally, there was a test of the key $278-279 resistance zone, where sellers took a stand.
A swing high was formed near $279 and the price recently corrected lower. It broke the $272 level and the 23.6% Fib retracement level of the upside from the $252 low to $279 high. However, the correction found support near the $265 support area. Moreover, there is a crucial bullish trend line forming with support near $266 on the 4-hours chart.
The 50% Fib retracement level of the upside from the $252 low to $279 high is also acting as a buy zone. If the price fails to stay above the trend line and $265, there could be a downside extension. The next key support is near $258 or the 76.4% Fib retracement level of the upside from the $252 low to $279 high. If there are more losses, the price could test $255 and the 55 simple moving average (4-hours).
On the upside, the $278-279 resistance zone holds a lot of importance. If there is an upside break above the $278-279 resistance zone, the price could accelerate towards the $288 swing high. Above $288, the price is likely to surge towards the $300 and $305 levels.

Looking at the chart, Ethereum price is clearly struggling to surpass the $278-279 resistance zone. If it continues to struggle, there are chances of a downside correction below the $265 and $260 support. If not, the price could climb towards the $300 and $305 levels in the near term.
Technical indicators
4 hours MACD – The MACD for ETH/USD is slowly moving into the bearish zone.
4 hours RSI (Relative Strength Index) – The RSI for ETH/USD is declining towards the 50 level.
Key Support Levels – $265, followed by the $258 zone.
Key Resistance Levels – $279 and $288.


Leave a Reply
You must be logged in to post a comment.