- Tron price remained well above the $0.0300 level and recently traded higher against the US Dollar.
- TRX price traded above the $0.0330 resistance, but it is facing a solid resistance near $0.0340.
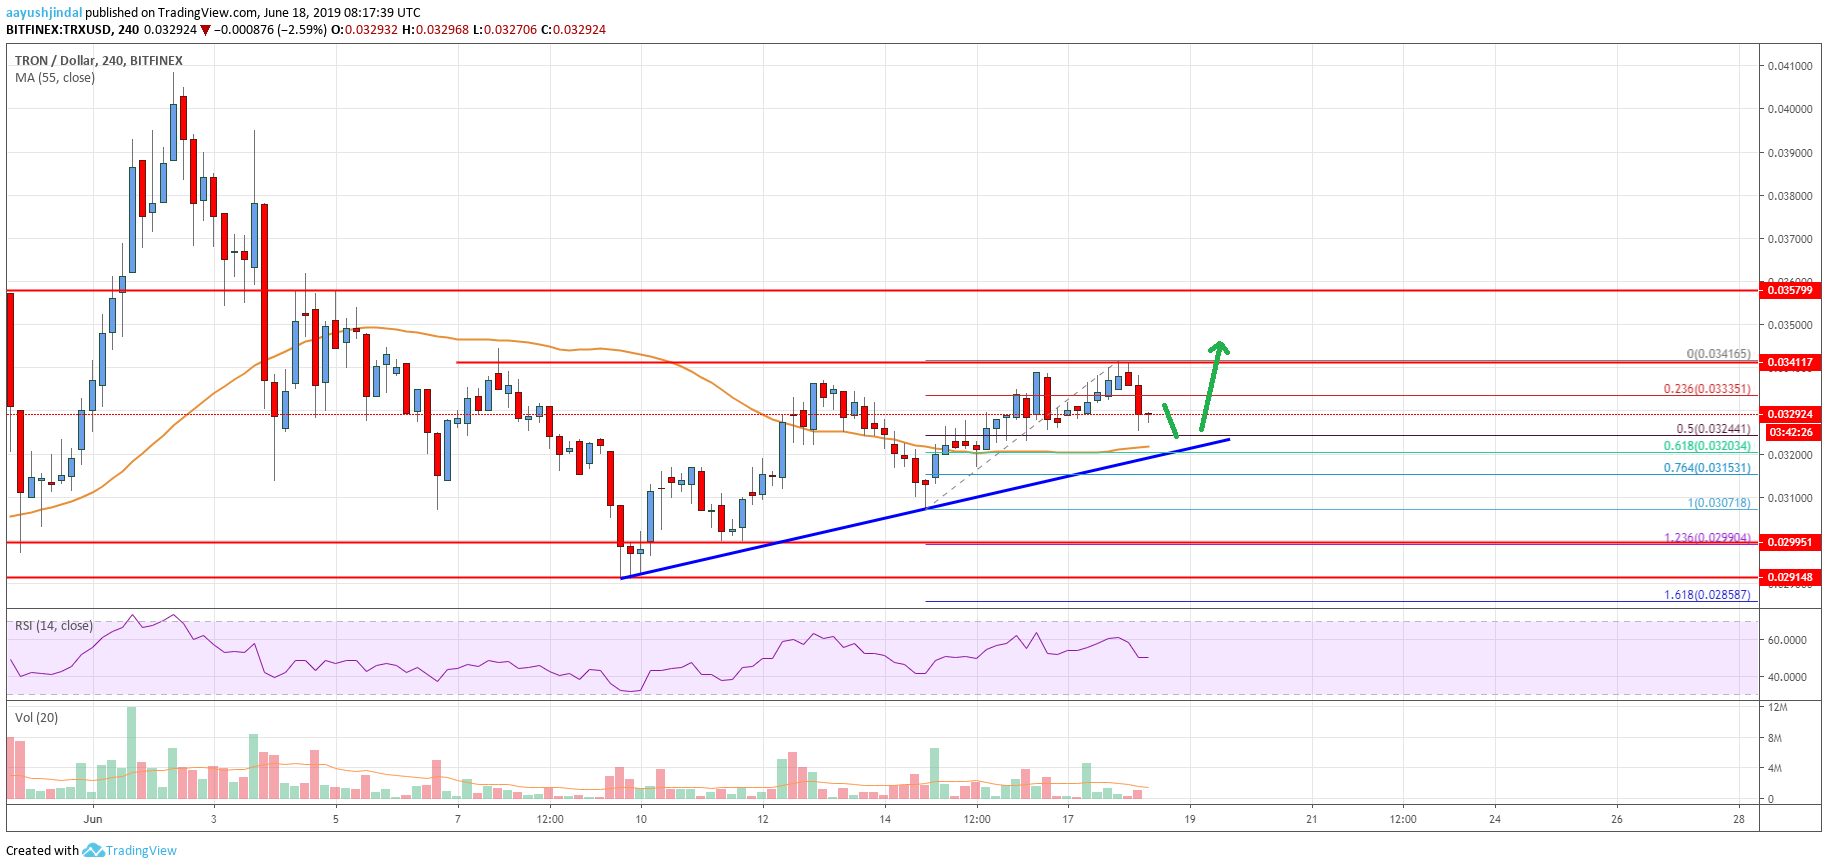
- There is a key bullish trend line forming with support near $0.0322 on the 4-hours chart (data feed via Bitfinex).
- The price is currently correcting lower, but it is likely to break the $0.0340 resistance in the near term.
TRON price recently climbed higher and tested key resistances against the US Dollar, but declined vs bitcoin. TRX price must stay above $0.0320 to climb further above $0.0340 and $0.0350.
Tron Price Analysis
After setting above $0.0300, there was a steady rise in TRON price against the US Dollar. The TRX/USD pair traded above the $0.0320 resistance level to enter a positive zone. Moreover, there was a close above the $0.0325 level and the 55 simple moving average (4-hours). The price even traded above the $0.0335 level, but it struggled to gains strength above the $0.0340 level.
A swing high was formed at $0.0341 and the price recently corrected lower. It broke the $0.0330 level and the 23.6% Fibonacci retracement level of the last wave from the $0.0307 low $0.0341 high. However, the price remained well bid above the $0.0325 level and the 55 simple moving average (4-hours). Additionally, the 50% Fibonacci retracement level of the last wave from the $0.0307 low $0.0341 high seems to be acting as a support.
There is also a key bullish trend line forming with support near $0.0322 on the 4-hours chart. Therefore, the price remains well supported near the $0.0325 level. If there is a downside break below $0.0322, the price could move back in a bearish zone.
On the upside, the main resistance is near the $0.0340 and $0.0341 levels. If there is an upside break above $0.0340, the price is likely to surge above the $0.0350 resistance. The next key resistances are near $0.0365 and $0.0372.

The chart indicates that TRX price is trading nicely above the $0.0325 support and the 55 simple moving average (4-hours). Therefore, there are high chances of more upsides above the $0.0340 and $0.0350 resistances. Only a close below $0.0322 and the 55 simple moving average (4-hours) is likely to set the pace for more losses in the near term. The next main support is at $0.0300. An intermediate support is the 76.4% Fibonacci retracement level of the last wave from the $0.0307 low $0.0341 high.
Technical Indicators
4 hours MACD – The MACD for TRX/USD is slowly losing momentum in the bearish zone.
4 hours RSI – The RSI for TRX/USD is currently near the 50 level, with a bullish angle.
Key Support Levels – $0.0325 and $0.0322.
Key Resistance Levels – $0.0340, $0.0350 and $0.0360.


Leave a Reply
You must be logged in to post a comment.