
- Litecoin price is currently consolidating losses above the $45.50 and $46.00 support levels against the US Dollar.
- LTC price is still facing hurdles near the $50.00 level and the 55 simple moving average (4-hours).
- There is a major contracting triangle forming with resistance near $49.80 on the 4-hours chart of the LTC/USD pair (data feed from Coinbase).
- The pair must break the $50.00 and $51.50 resistance levels to move into a bullish zone.
Litecoin price is currently trading in a range above the $45.00 support against the US Dollar, while bitcoin is rising. LTC price is likely to accelerate higher if it clears $51.50.
Litecoin Price Analysis
In the past few sessions, there were mostly range moves in bitcoin, Ethereum, ripple, and litecoin against the US Dollar. Earlier, LTC price found support near the $45.00 zone and it settled below the 55 simple moving average (4-hours).
Recently, bitcoin price climbed higher above $10,800, but litecoin is struggling to gain momentum. It is facing a strong resistance near the $49.70 and $50.00 levels. The 55 simple moving average (4-hours) is also near the $49.50 to act as a hurdle.
More importantly, there is a major contracting triangle forming with resistance near $49.80 on the 4-hours chart of the LTC/USD pair. The triangle resistance is close to the 23.6% Fib retracement level of the key drop from the $64.35 high to $45.20 swing low.
If there is an upside break above the triangle resistance and $50.00, the price could test the next key resistance near the $51.35 and $51.50 levels. If there are more upsides, the price could rise steadily towards the $55.00 resistance.
The $55.00 barrier might be crucial since it is close to the 50% Fib retracement level of the key drop from the $64.35 high to $45.20 swing low.
Conversely, the price might fail to surpass the $49.80 and $50.00 resistance levels. An initial support is near the triangle lower trend line at $47.20. A clear break below the triangle support might accelerate losses and the price could even break the $46.00 support zone.
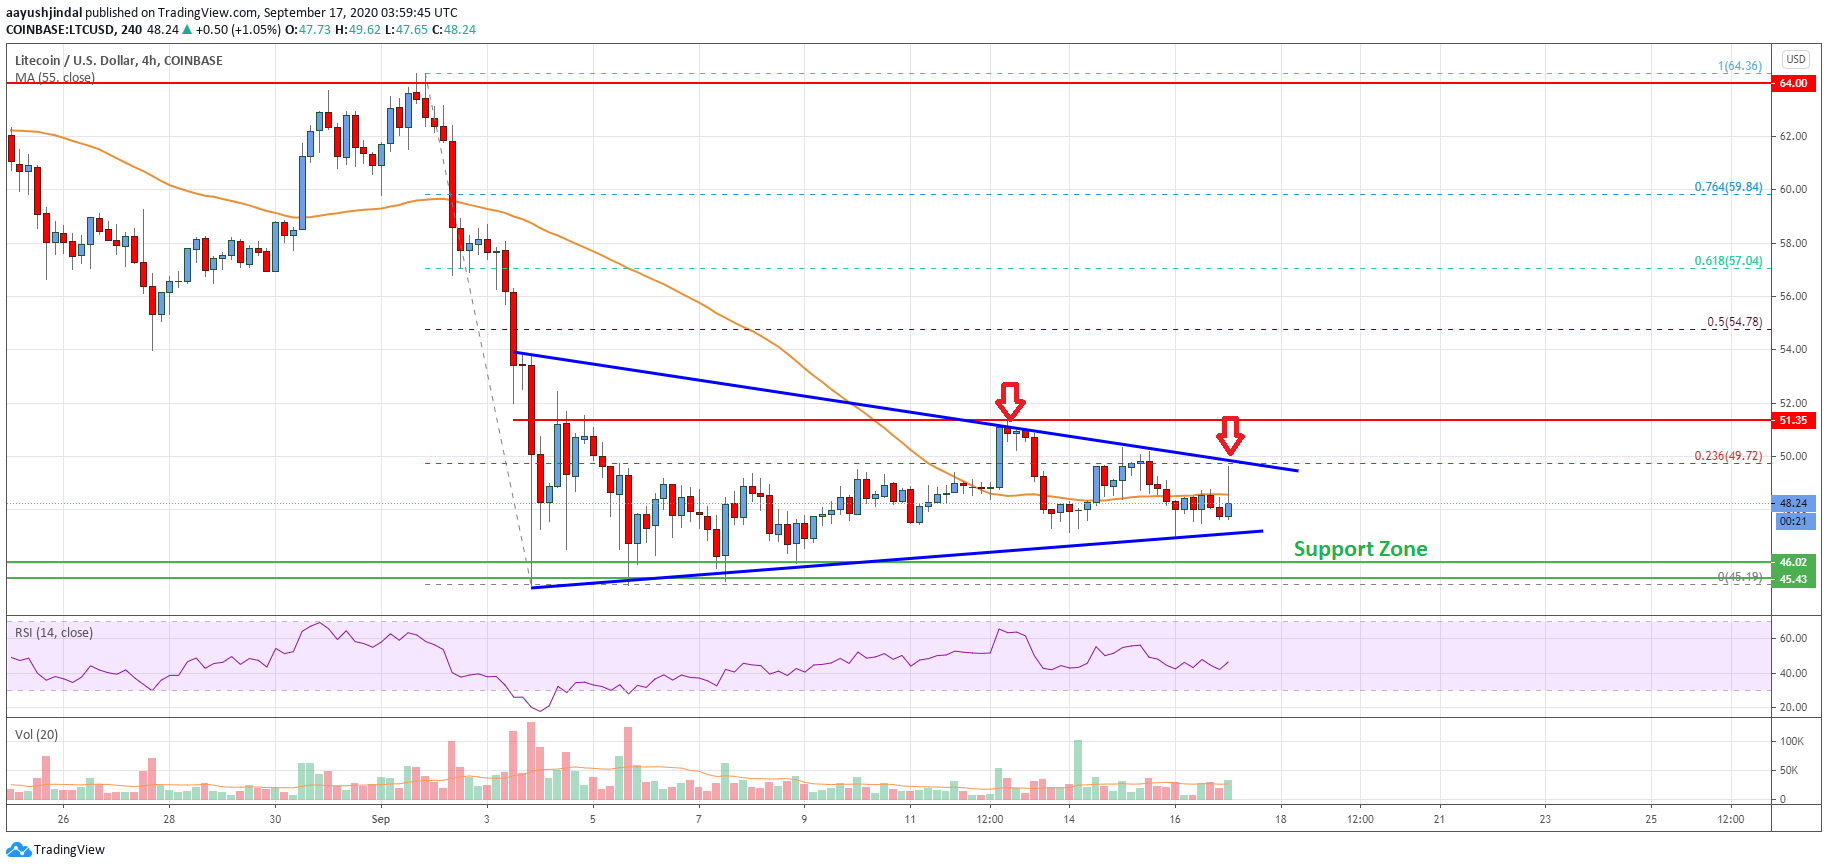
Looking at the chart, litecoin price is clearly approaching the next major break near the $51.50 level. Overall, the price must break the $50.00 and $51.50 resistance levels to move into a bullish zone in the near term.
Technical indicators
4 hours MACD – The MACD for LTC/USD is slowly gaining momentum in the bullish zone.
4 hours RSI (Relative Strength Index) – The RSI for LTC/USD is currently just below the 50 level.
Key Support Levels – $47.20 and $46.00.
Key Resistance Levels – $50.00 and $51.50.


Leave a Reply
You must be logged in to post a comment.