- Litecoin price started a steady increase from the $155 support zone against the US Dollar.
- LTC price is now trading well above $180 and the 55 simple moving average (4-hours).
- There was a break above a major bearish trend line with resistance near $175 on the 4-hours chart of the LTC/USD pair (data feed from Coinbase).
- The pair is likely to clear the $200 resistance and started a strong increase in the near term.
Litecoin price is gaining momentum above $185 against the US Dollar, similar to bitcoin. LTC price must settle above $200 to start a fresh pump.
Litecoin Price Analysis
Recently, there was a steady recovering in bitcoin, Ethereum, ripple, and litecoin against the US Dollar. Earlier, LTC traded close to the $250 support level. A low was formed near $253 before the pair formed a base above the $255 level.
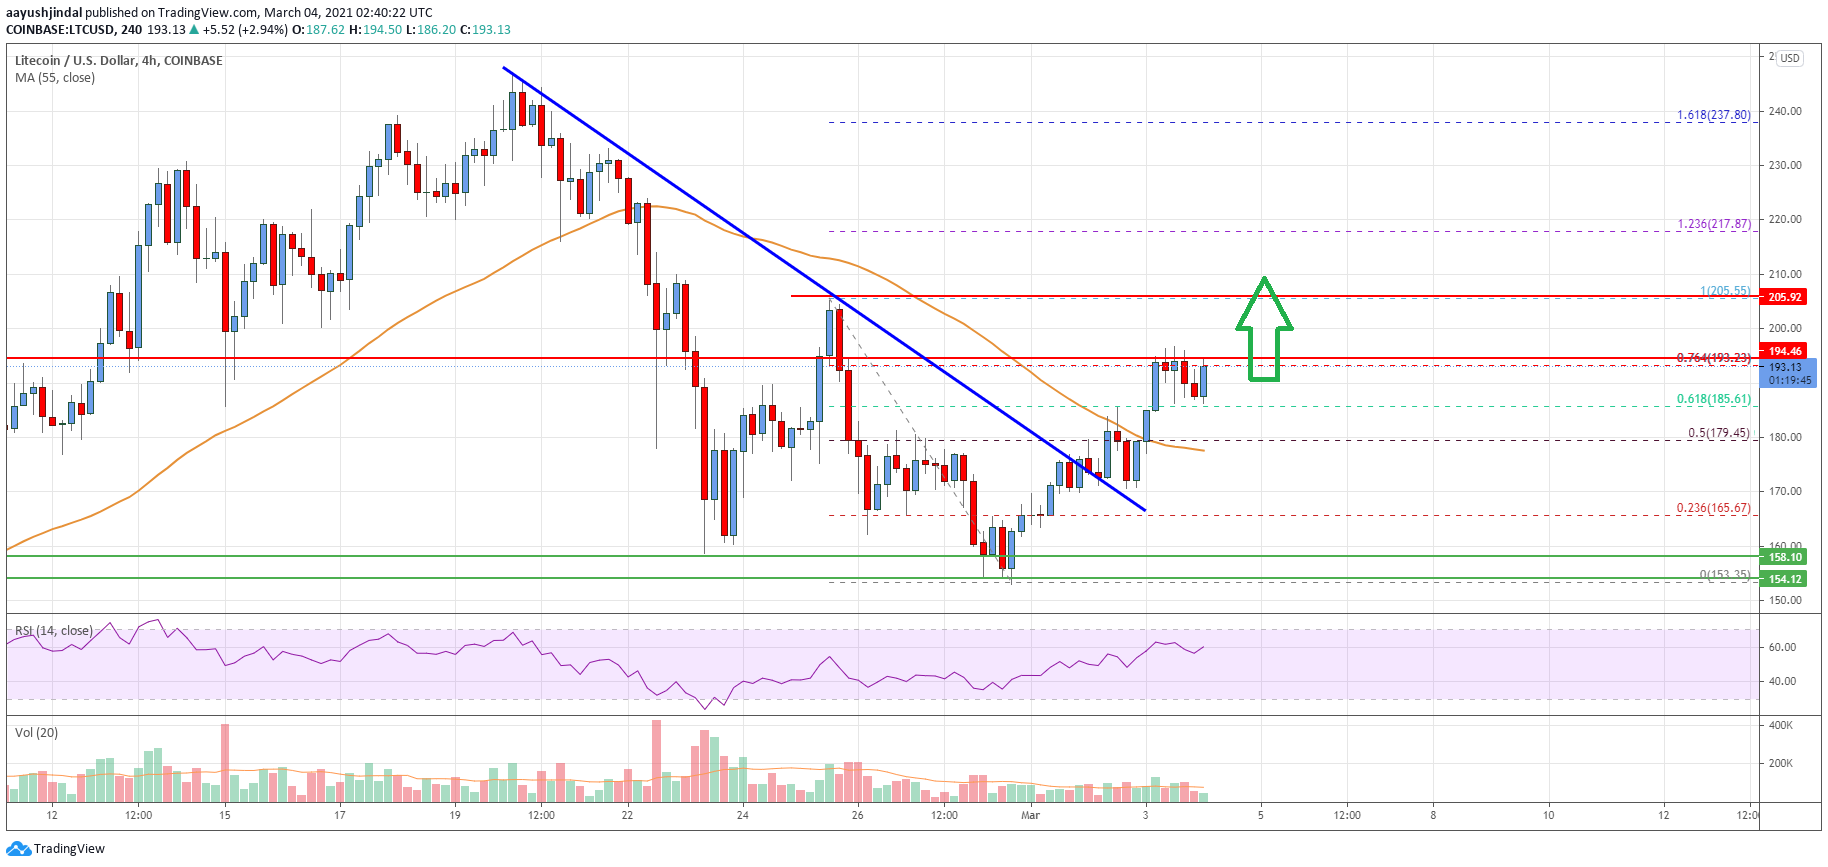
As a result, the price started a steady increase above the $170 and $175 resistance levels. There was a break above the 50% Fib retracement level of the downward move from the $205 high to $153 swing low.
There was also a break above a major bearish trend line with resistance near $175 on the 4-hours chart of the LTC/USD pair. The pair is now trading well above $180 and the 55 simple moving average (4-hours). It is now trading near the $195 resistance zone.
The 76.4% Fib retracement level of the downward move from the $205 high to $153 swing low is also acting as a resistance. If there is a clear break above the $195 and $200 levels, the price could accelerate higher towards the $220 level. The next key resistance is near the $235 level.
Conversely, there is a risk of another decline from the $195 and $200 resistance levels. An initial support is near the $185 level. The first major support is near $180 level and the 55 simple moving average (4-hours).
If there is a downside break below the $180 support level, the price could continue to move down towards the $175 and $170 levels.

Looking at the chart, litecoin price is now trading well below $180 and the 55 simple moving average (4-hours). Overall, the price is likely to clear the $200 resistance and started a strong increase in the near term.
Technical indicators
4 hours MACD – The MACD for LTC/USD is currently gaining pace in the bullish zone.
4 hours RSI (Relative Strength Index) – The RSI for LTC/USD is now well above the 50 level.
Key Support Levels – $180 and $170.
Key Resistance Levels – $200 and $220.


Leave a Reply
You must be logged in to post a comment.