- Litecoin price surged above towards the $93.00 level before correcting lower against the US Dollar.
- LTC price is trading nicely above $80.00 and the 55 simple moving average (4-hours).
- There is a key contracting triangle forming with resistance near $88.50 on the 4-hours chart of the LTC/USD pair (data feed from Coinbase).
- The pair is likely to start a fresh surge if there is a clear break above $88.60 and $90.00.
Litecoin price is currently consolidating gains from above $85.00 against the US Dollar, similar to bitcoin. LTC price could rally again above $90.00 as long as it is above $80.00.
Litecoin Price Analysis
This week, there was a minor downside correction in bitcoin, Ethereum, ripple, and litecoin against the US Dollar. Earlier, LTC price gained bullish momentum above the $80.00 and $85.00 resistance levels.
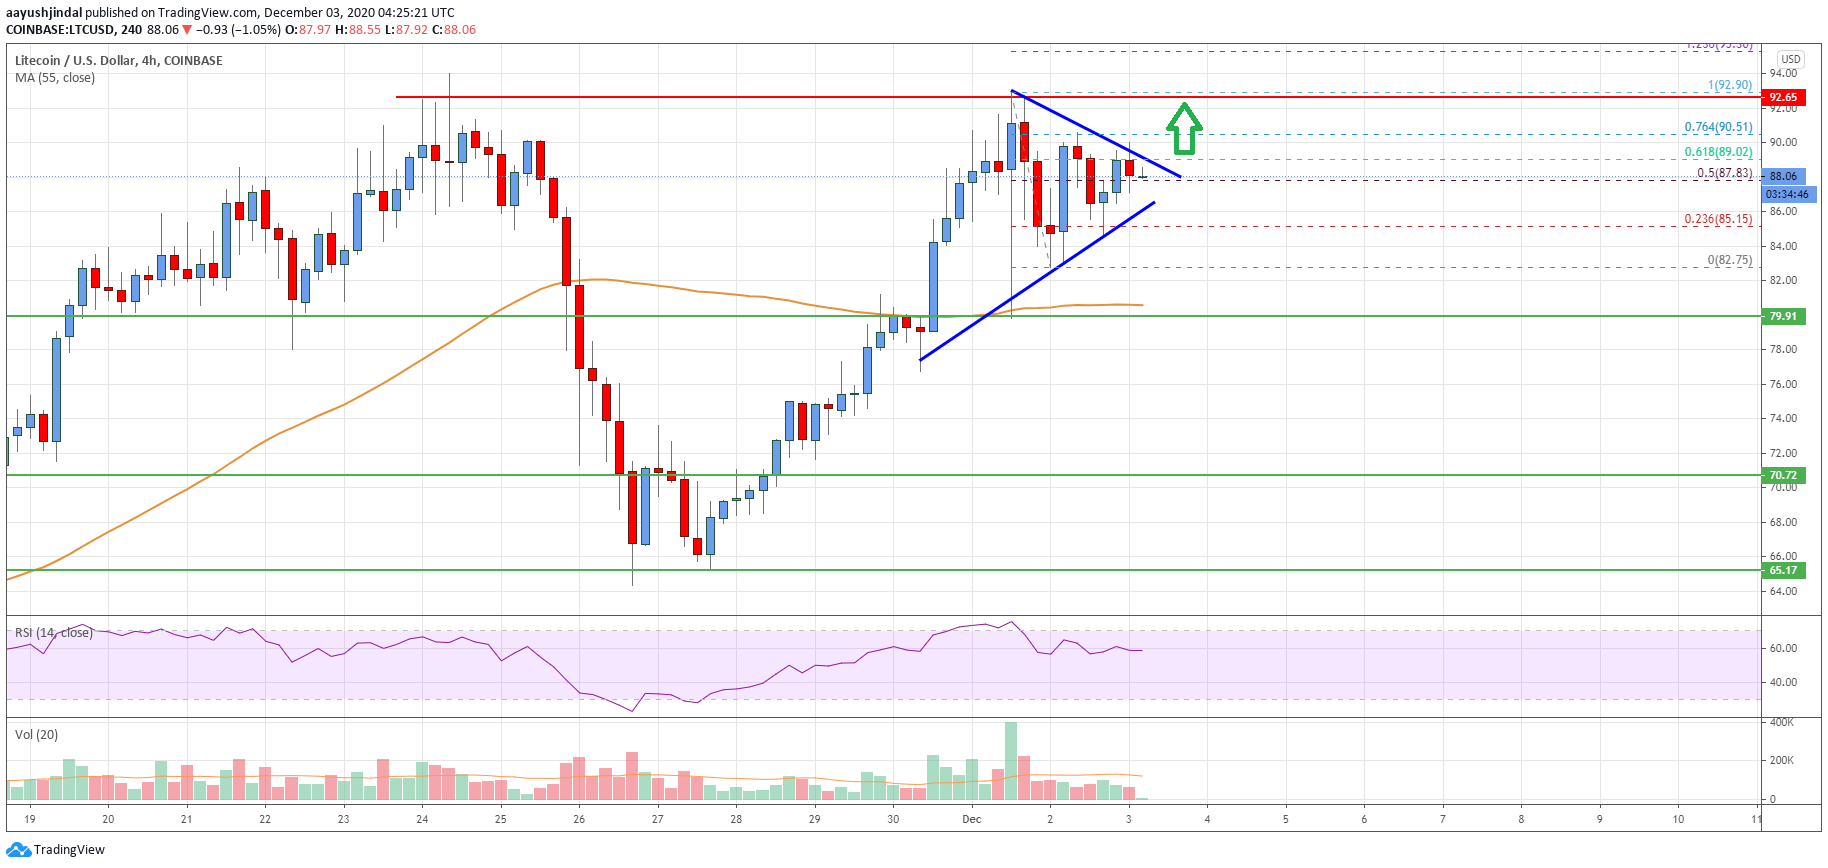
There was also a break above the $90.00 resistance level and a close above the 55 simple moving average (4-hours). The last swing high was formed near $92.90 before the price started trading in a broad range.
The recent swing low was formed near $82.75 before the price corrected higher. The price climbed above the $85.00 and $87.00 levels. There was also a break above the 50% Fib retracement level of the recent decline from the $92.90 high to $82.75 low.
Litecoin price is now trading above the $86.00 level, but it is facing hurdles near $88.60 and $90.00. There is also a key contracting triangle forming with resistance near $88.50 on the 4-hours chart of the LTC/USD pair.
The triangle resistance is close to the 61.8% Fib retracement level of the recent decline from the $92.90 high to $82.75 low. A successful break above the triangle resistance and then a follow up move above the $90.00 resistance could open the doors for a larger increase.
Conversely, the price could break the $86.00 and $85.00 support levels to start a fresh decline. The next major support is near the $80.00 level and the 55 simple moving average (4-hours).
Looking at the chart, litecoin price is clearly showing positive signs above $85.00 and the 55 simple moving average (4-hours). Overall, the price is likely to start a fresh surge if there is a clear break above $88.60 and $90.00.
Technical indicators
4 hours MACD – The MACD for LTC/USD is currently losing momentum in the bearish zone.
4 hours RSI (Relative Strength Index) – The RSI for LTC/USD is still well above the 50 level.
Key Support Levels – $86.00 and $85.00.
Key Resistance Levels – $88.60 and $90.00.