- Litecoin price surged above $85.00 and traded as high as $94.09 against the US Dollar.
- LTC price started a sharp downside correction below $80.00 and the 55 simple moving average (4-hours).
- There is a key bullish trend line forming with support near $71.00 on the 4-hours chart of the LTC/USD pair (data feed from Coinbase).
- The pair remains well supported as long as there is no close below the $70.00 support zone.
Litecoin price is currently correcting gains from $94.00 against the US Dollar, similar to bitcoin. LTC price is likely to bounce back unless it breaks the $70.00 support.
Litecoin Price Analysis
This week, there was a strong rise in bitcoin, Ethereum, ripple, and litecoin corrected lower against the US Dollar. Earlier, LTC price broke the $75.00 and $80.00 resistance levels to move further into a positive zone.
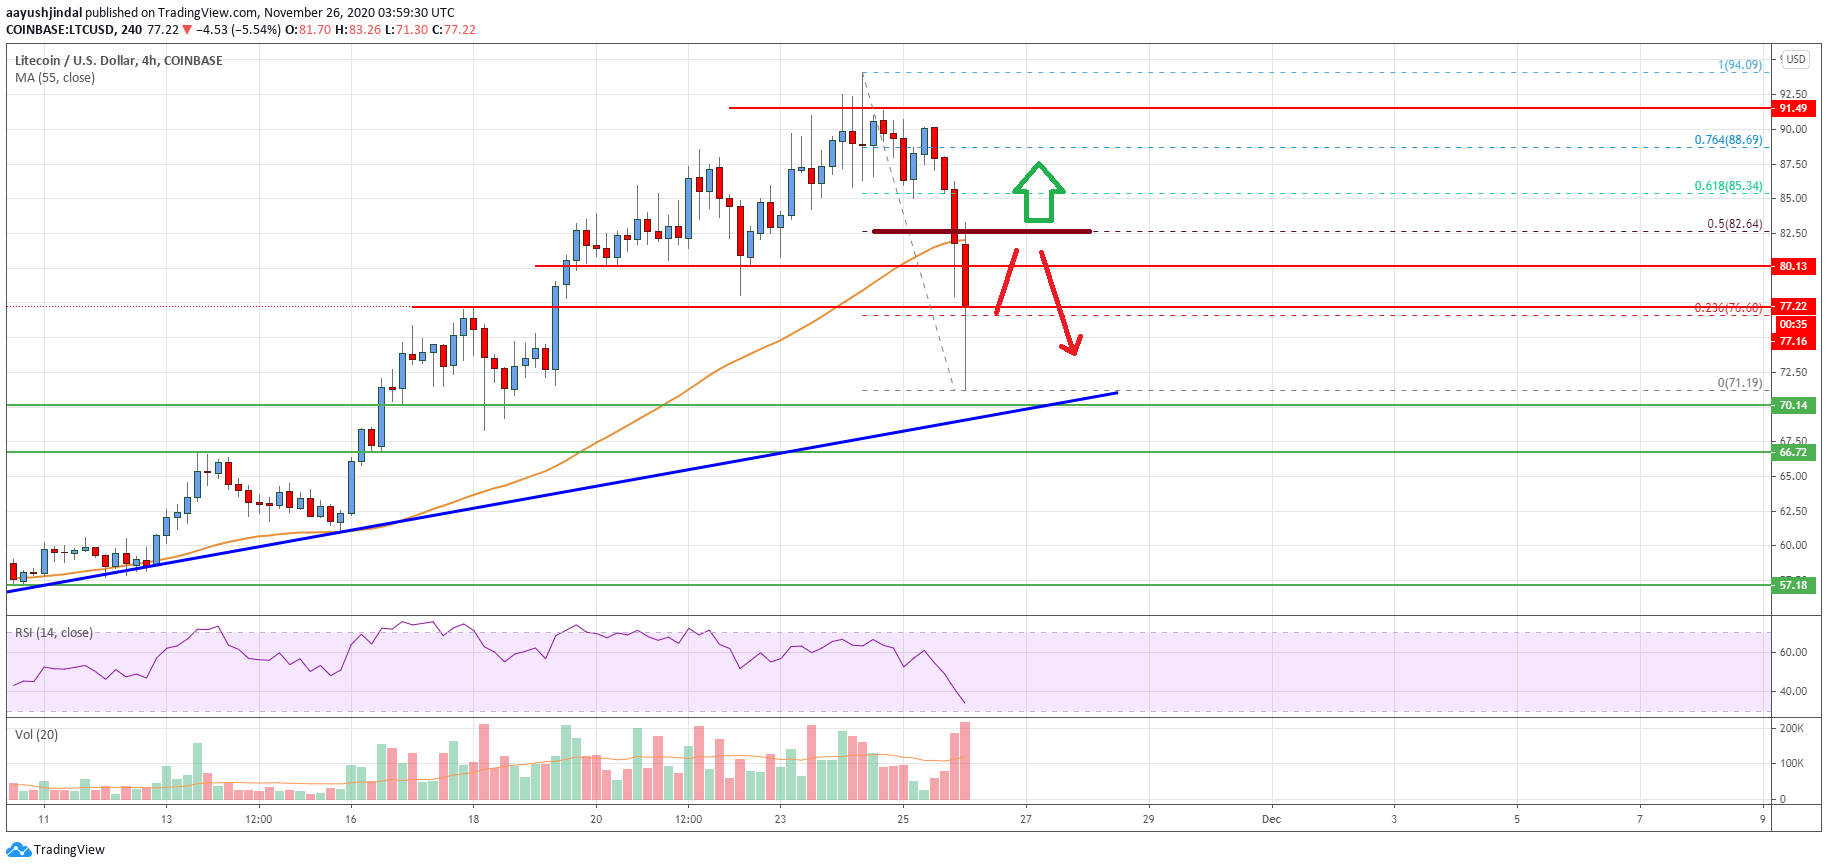
The price even broke the $90.00 resistance level and settled above the 55 simple moving average (4-hours). However, there was no test of the $100.00 resistance. The price traded as high as $94.09 and recently started a sharp downside correction.
There was a break below the $80.00 support level and the 55 simple moving average (4-hours). The price even broke the $74.00 support and traded as low as $71.19.
It is currently correcting higher and trading above $75.00. Litecoin is testing the 23.6% Fib retracement level of the recent decline from the $94.09 high to $71.19 low. The first major resistance on the upside is near the $80.00 level (the recent breakdown zone).
The main resistance is forming near the $82.00 level and the 55 simple moving average (4-hours). It is close to the 50% Fib retracement level of the recent decline from the $94.09 high to $71.19 low.
A clear break above the $80.00 and $82.00 resistance levels may perhaps start a fresh increase in the coming sessions. Conversely, the price is likely to continue lower below the $75.00 level. On the downside, there is a major support forming near $72.00 and $70.00.
There is also a key bullish trend line forming with support near $71.00 on the 4-hours chart of the LTC/USD pair. A downside break below the trend line support and then $70.00 could accelerate losses.
Looking at the chart, litecoin price is clearly correcting gains from $94.00. Overall, the price remains well supported as long as there is no close below the $70.00 support zone.
Technical indicators
4 hours MACD – The MACD for LTC/USD is currently gaining momentum in the bearish zone.
4 hours RSI (Relative Strength Index) – The RSI for LTC/USD is now well below the 50 level.
Key Support Levels – $72.00 and $70.00.
Key Resistance Levels – $80.00 and $82.00.